Experimentation
The experimentation is predicated on the sequential testing of the fully populated Atinverter V2 PCB as well as its integration with various software modules to evaluate and diagnose system-level functionality.
Standard PCB assembly practices were observed throughout the process, including component orientation checks, solder joint inspections, thorough visual examination, and continuity testing.
To successfully validate the operation of the Atinverter V2 device, verification of the following core subsystems is required:
- 5V Buck and 12V Boost Power Supplies
- ATMEGA328P Bootloaded Status
- PWM Inversion
- DC Voltage and Current Sensing
- AC Voltage and Current Sensing
In the next few sections, each subsystem is reported on their verification status, both from a hardware and software functionality standpoint.
Workbenches
To facilitate thorough testing of the various subsystems, two reliable workbenches were utilized. The primary workbench served as the main station for general testing activities, while the secondary workbench was dedicated specifically to validating the DC and AC current sensing functionality of the Atinverter V2 board.
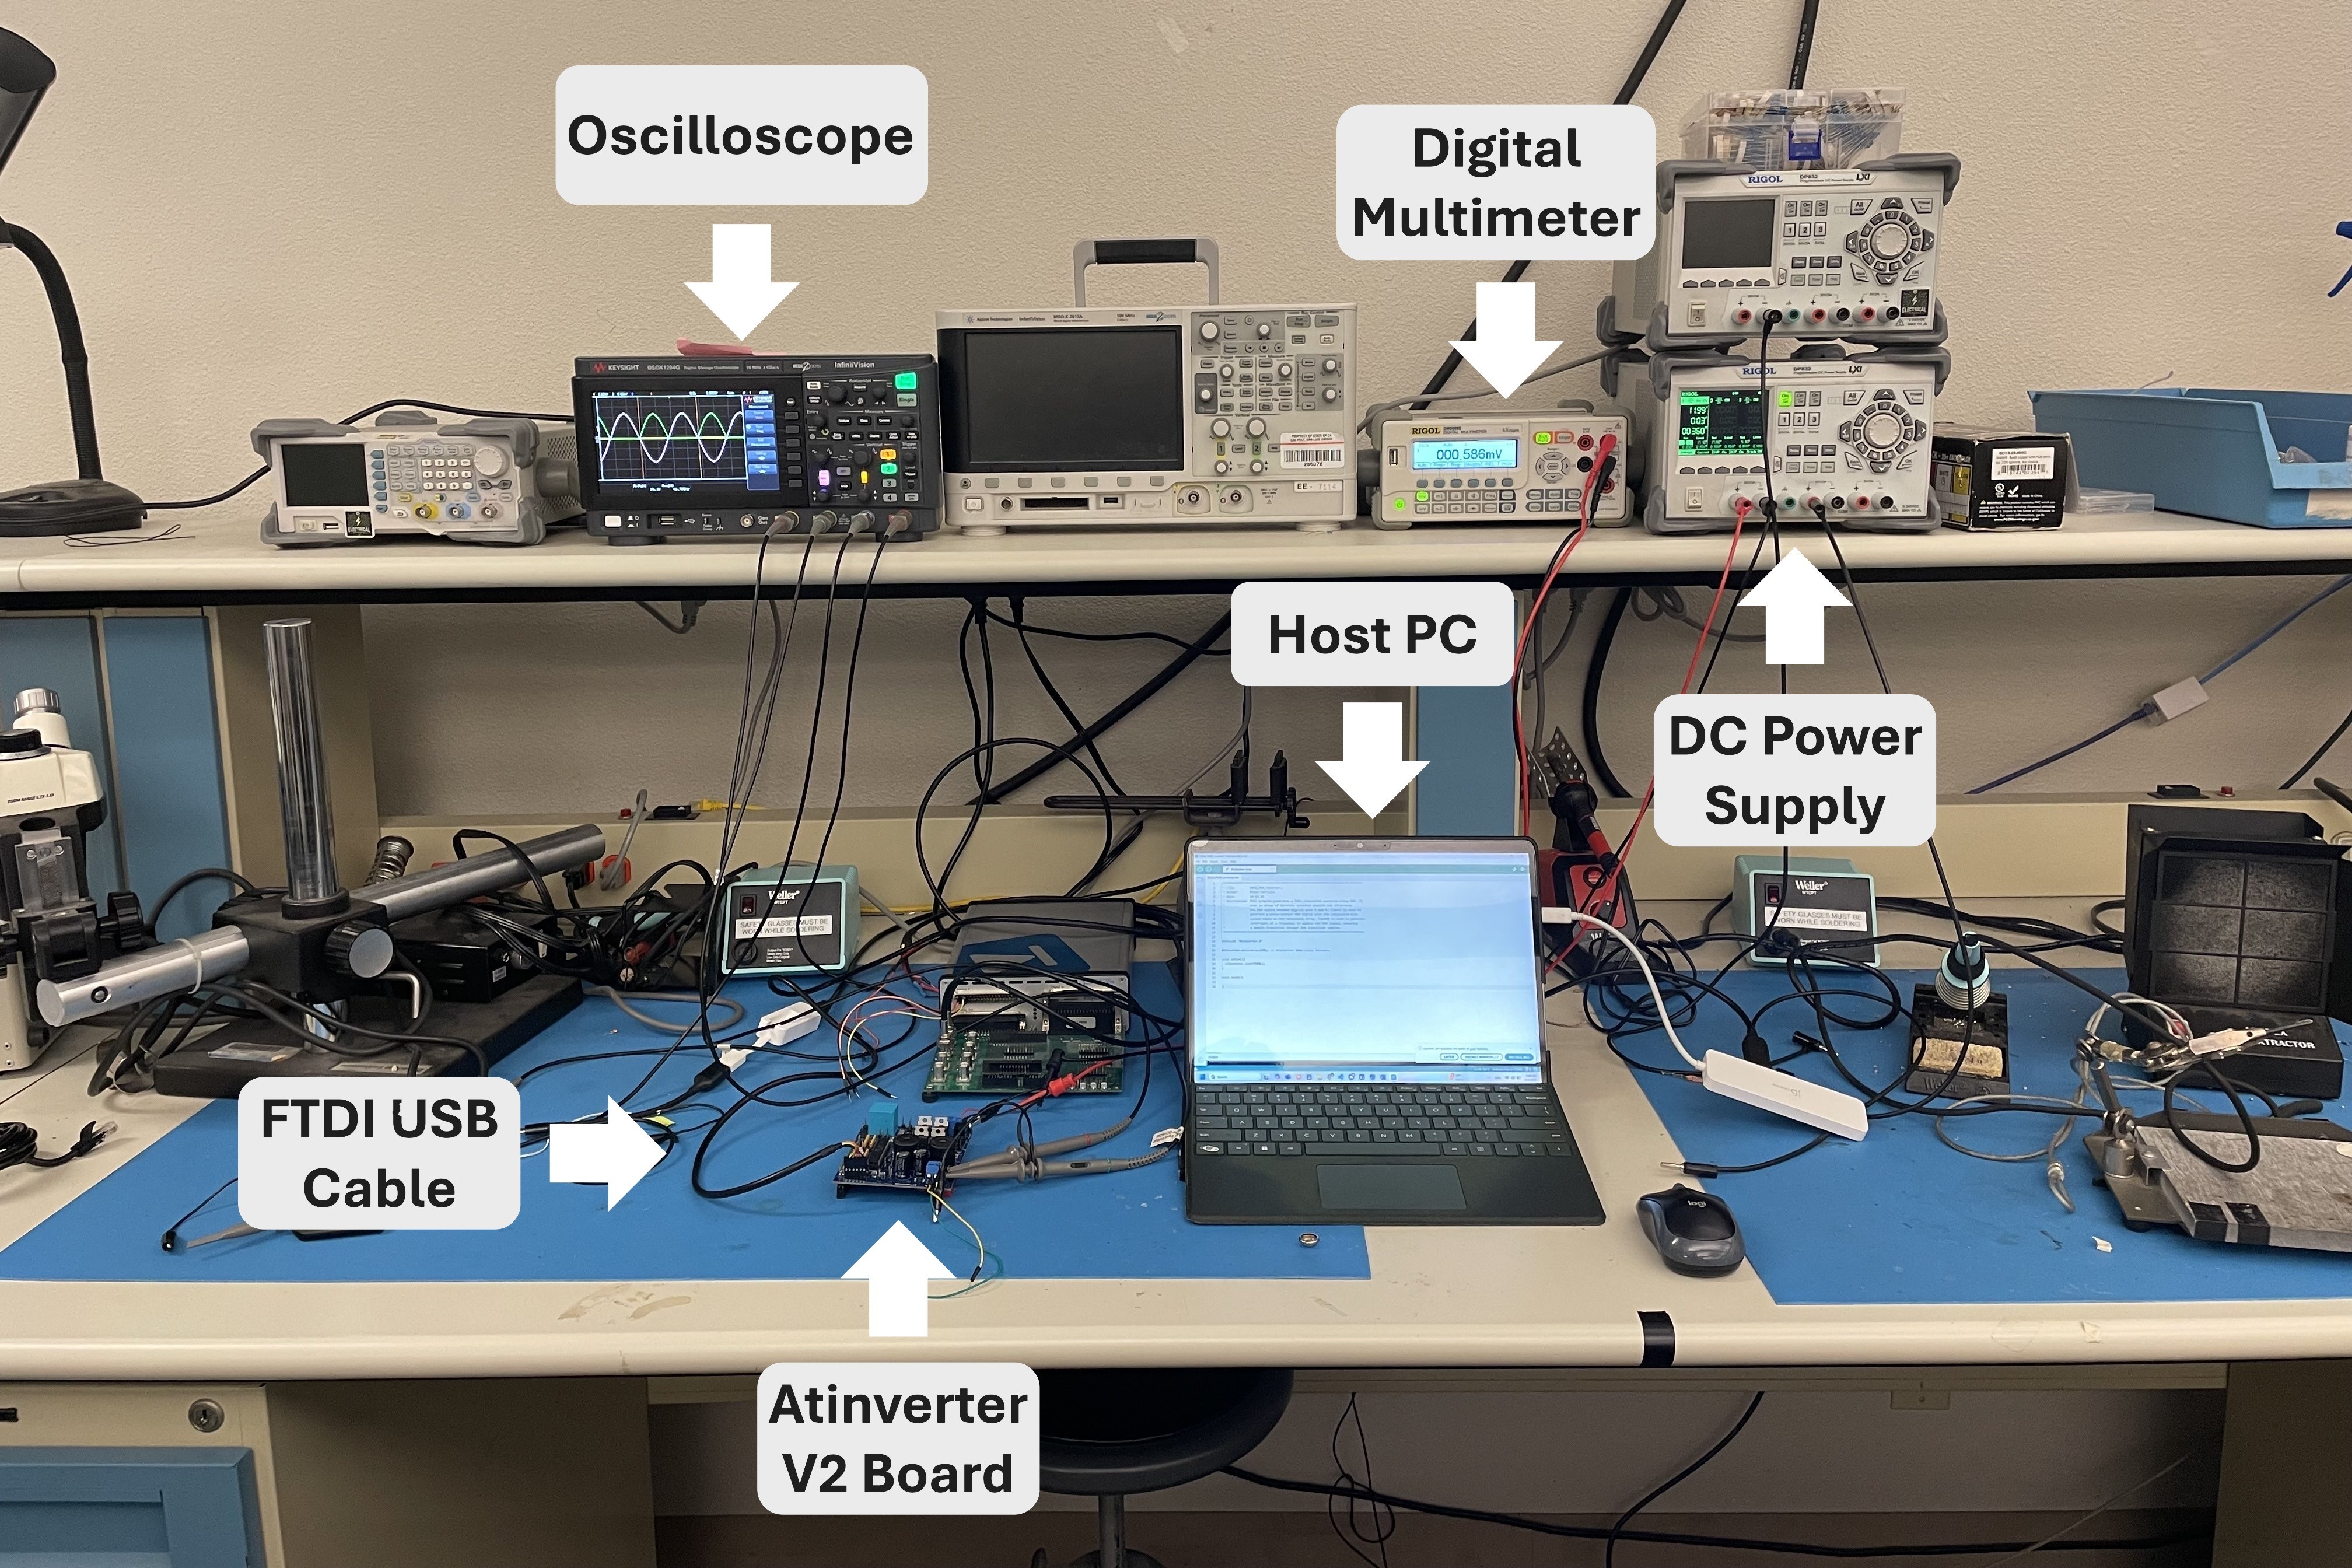
The DC input is powered by a Rigol DP832, using one or two of the channels depending on the voltage needed. When voltages requirements are above 30V, channels 1 and 2 are configured in series to deliver up to a 48V. The DM3058E digital multimeter is used to precisely measure the value of both the DC input voltage and the load resistance. The Keysight DSOX1204G oscilloscope captures key waveforms of the Atinverter V2 board including the power supply levels and the power inverter signals from the input to output. The host PC operates as the software hub, as this is where the user selects and uploads the firmware to the Atinverter V2 board via the FTDI to USB cable.
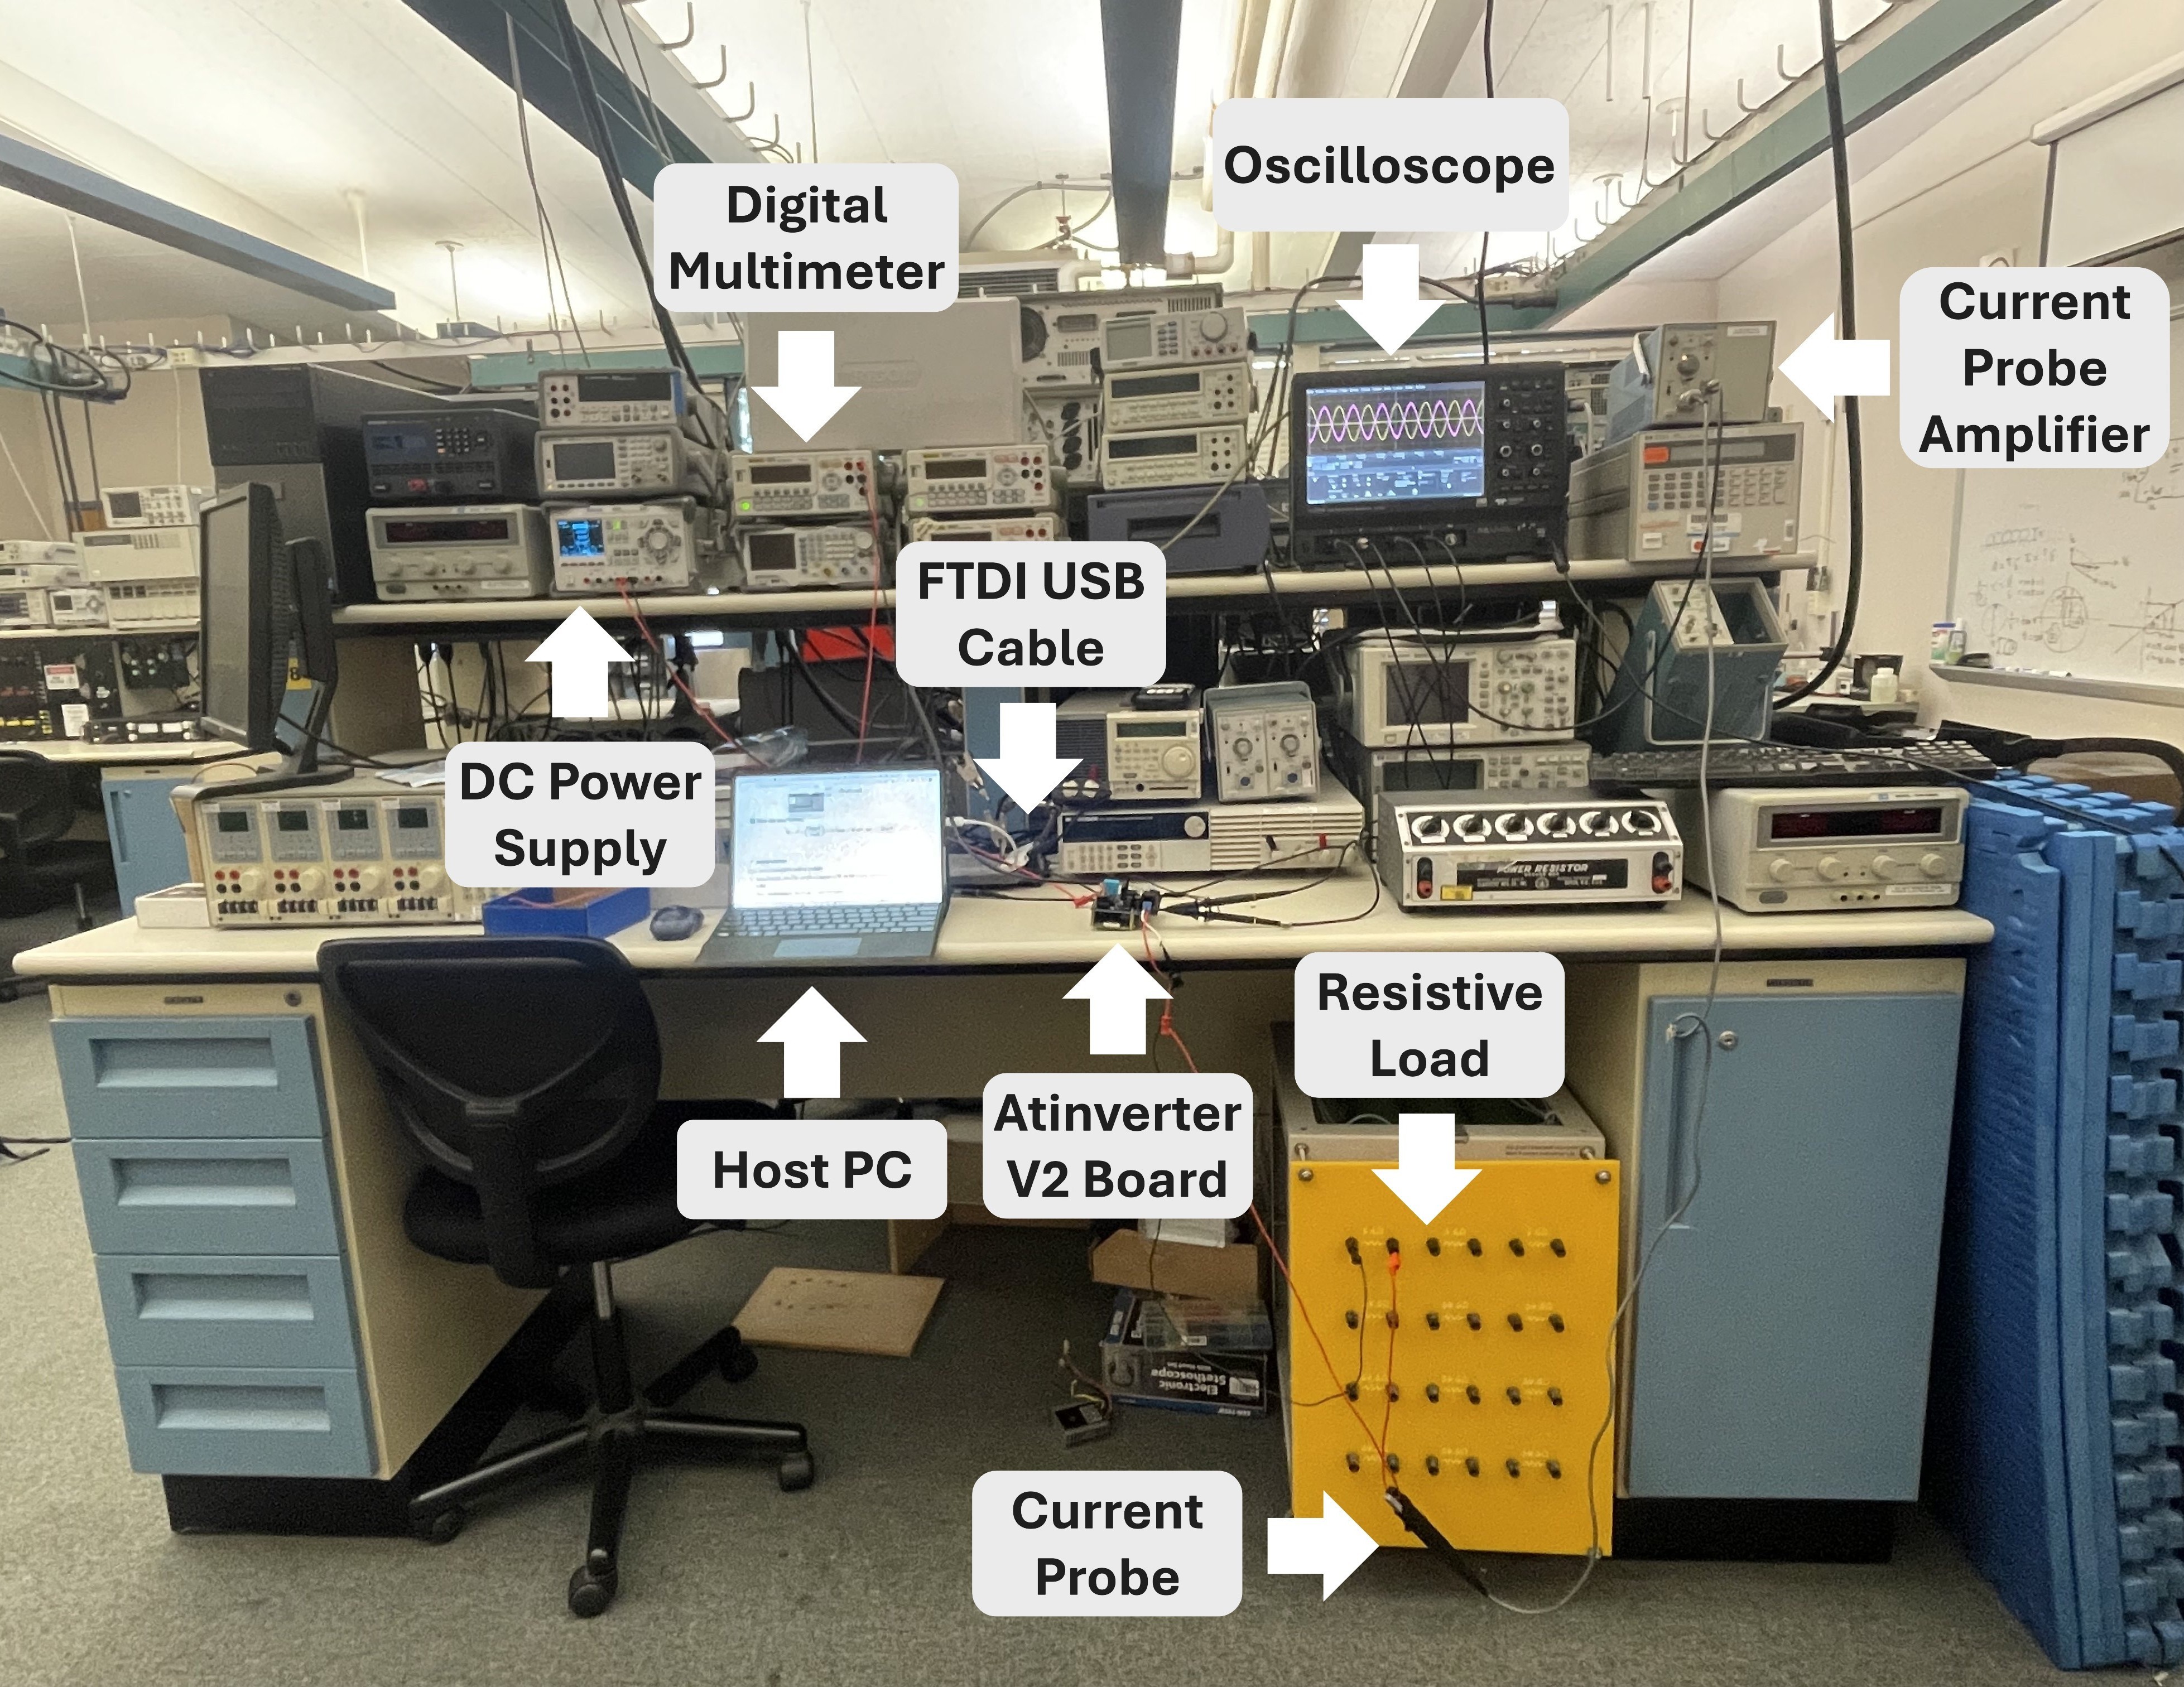
The second workbench builds upon the main setup and is optimized for testing the DC and AC current sensing functionality. It consists of the previously mentioned instruments, but with the addition of a current probe and current probe amplifier (Tektronix AM503). The current probe operates on the principle of magnetic induction, where it senses the current flowing through the conductor that clamps around the wire carrying the load current.
To ensure accurate scaling of the current signal, the oscilloscope is set to a fixed vertical scale value 10mV/div and the amplifier gain is adjusted accordingly based on the expected current magnitude. A high power resistive load box is connected to the output of the Atinverter V2 to set a known load condition for the DC and AC current tests.
In the following sections, a series of captures and data are displayed to report on the Atinverter V2 device behavior.
5V Buck and 12V Boost Power Supplies
A functioning board depends fundamentally on its power supplies. Before evaluating the rest of the hardware and software systems, the onboard power sources were inspected to verify appropriate voltage levels.
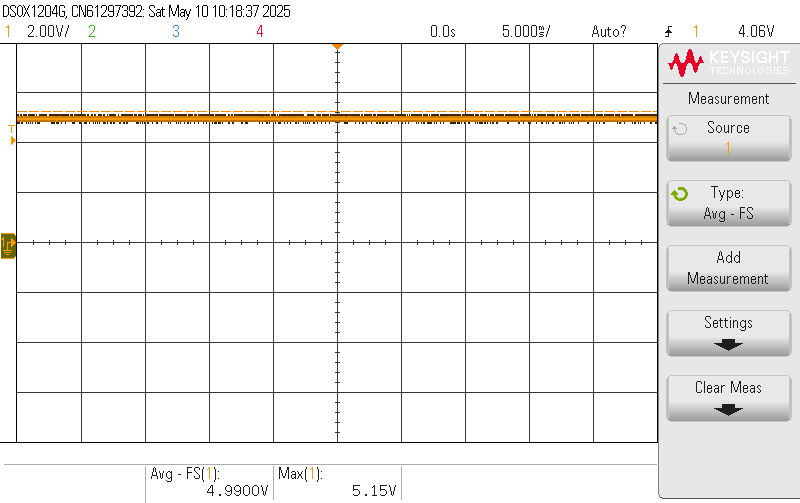
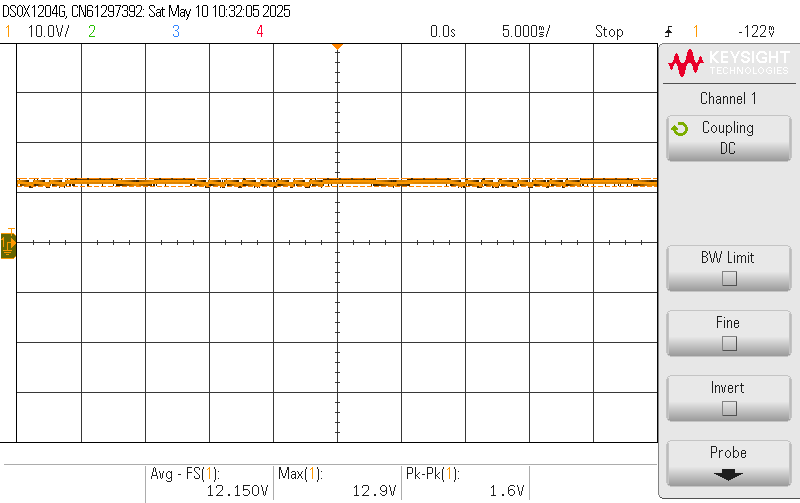
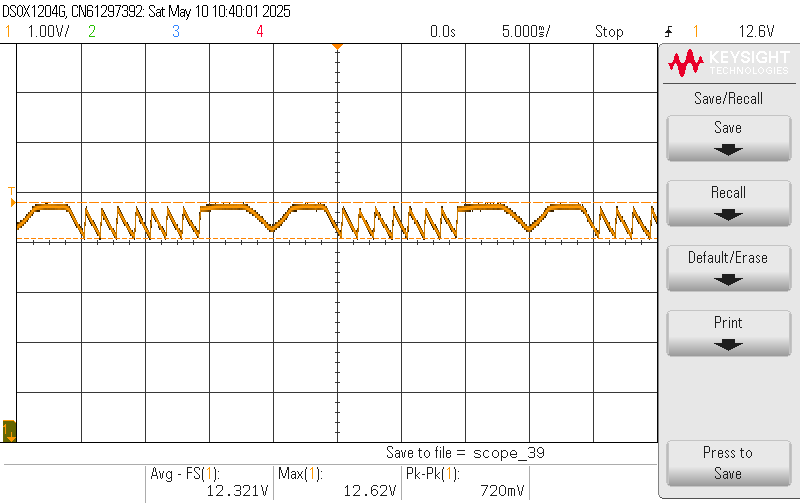
- Power supplies are functional, marginal deviations from the expected value.
- 12V Boost converter peak-to-peak ripple is significantly larger than the simulated value (72.88 mV as per the Boost Converter section), but not an issue since the output is still within the power supply conditions of the IR2302 (5V-20V).
ATMEGA328P Bootloaded Status
To confirm successful bootloading and basic functionality of the ATMEGA328P microcontroller, the Blink.ino was executed.
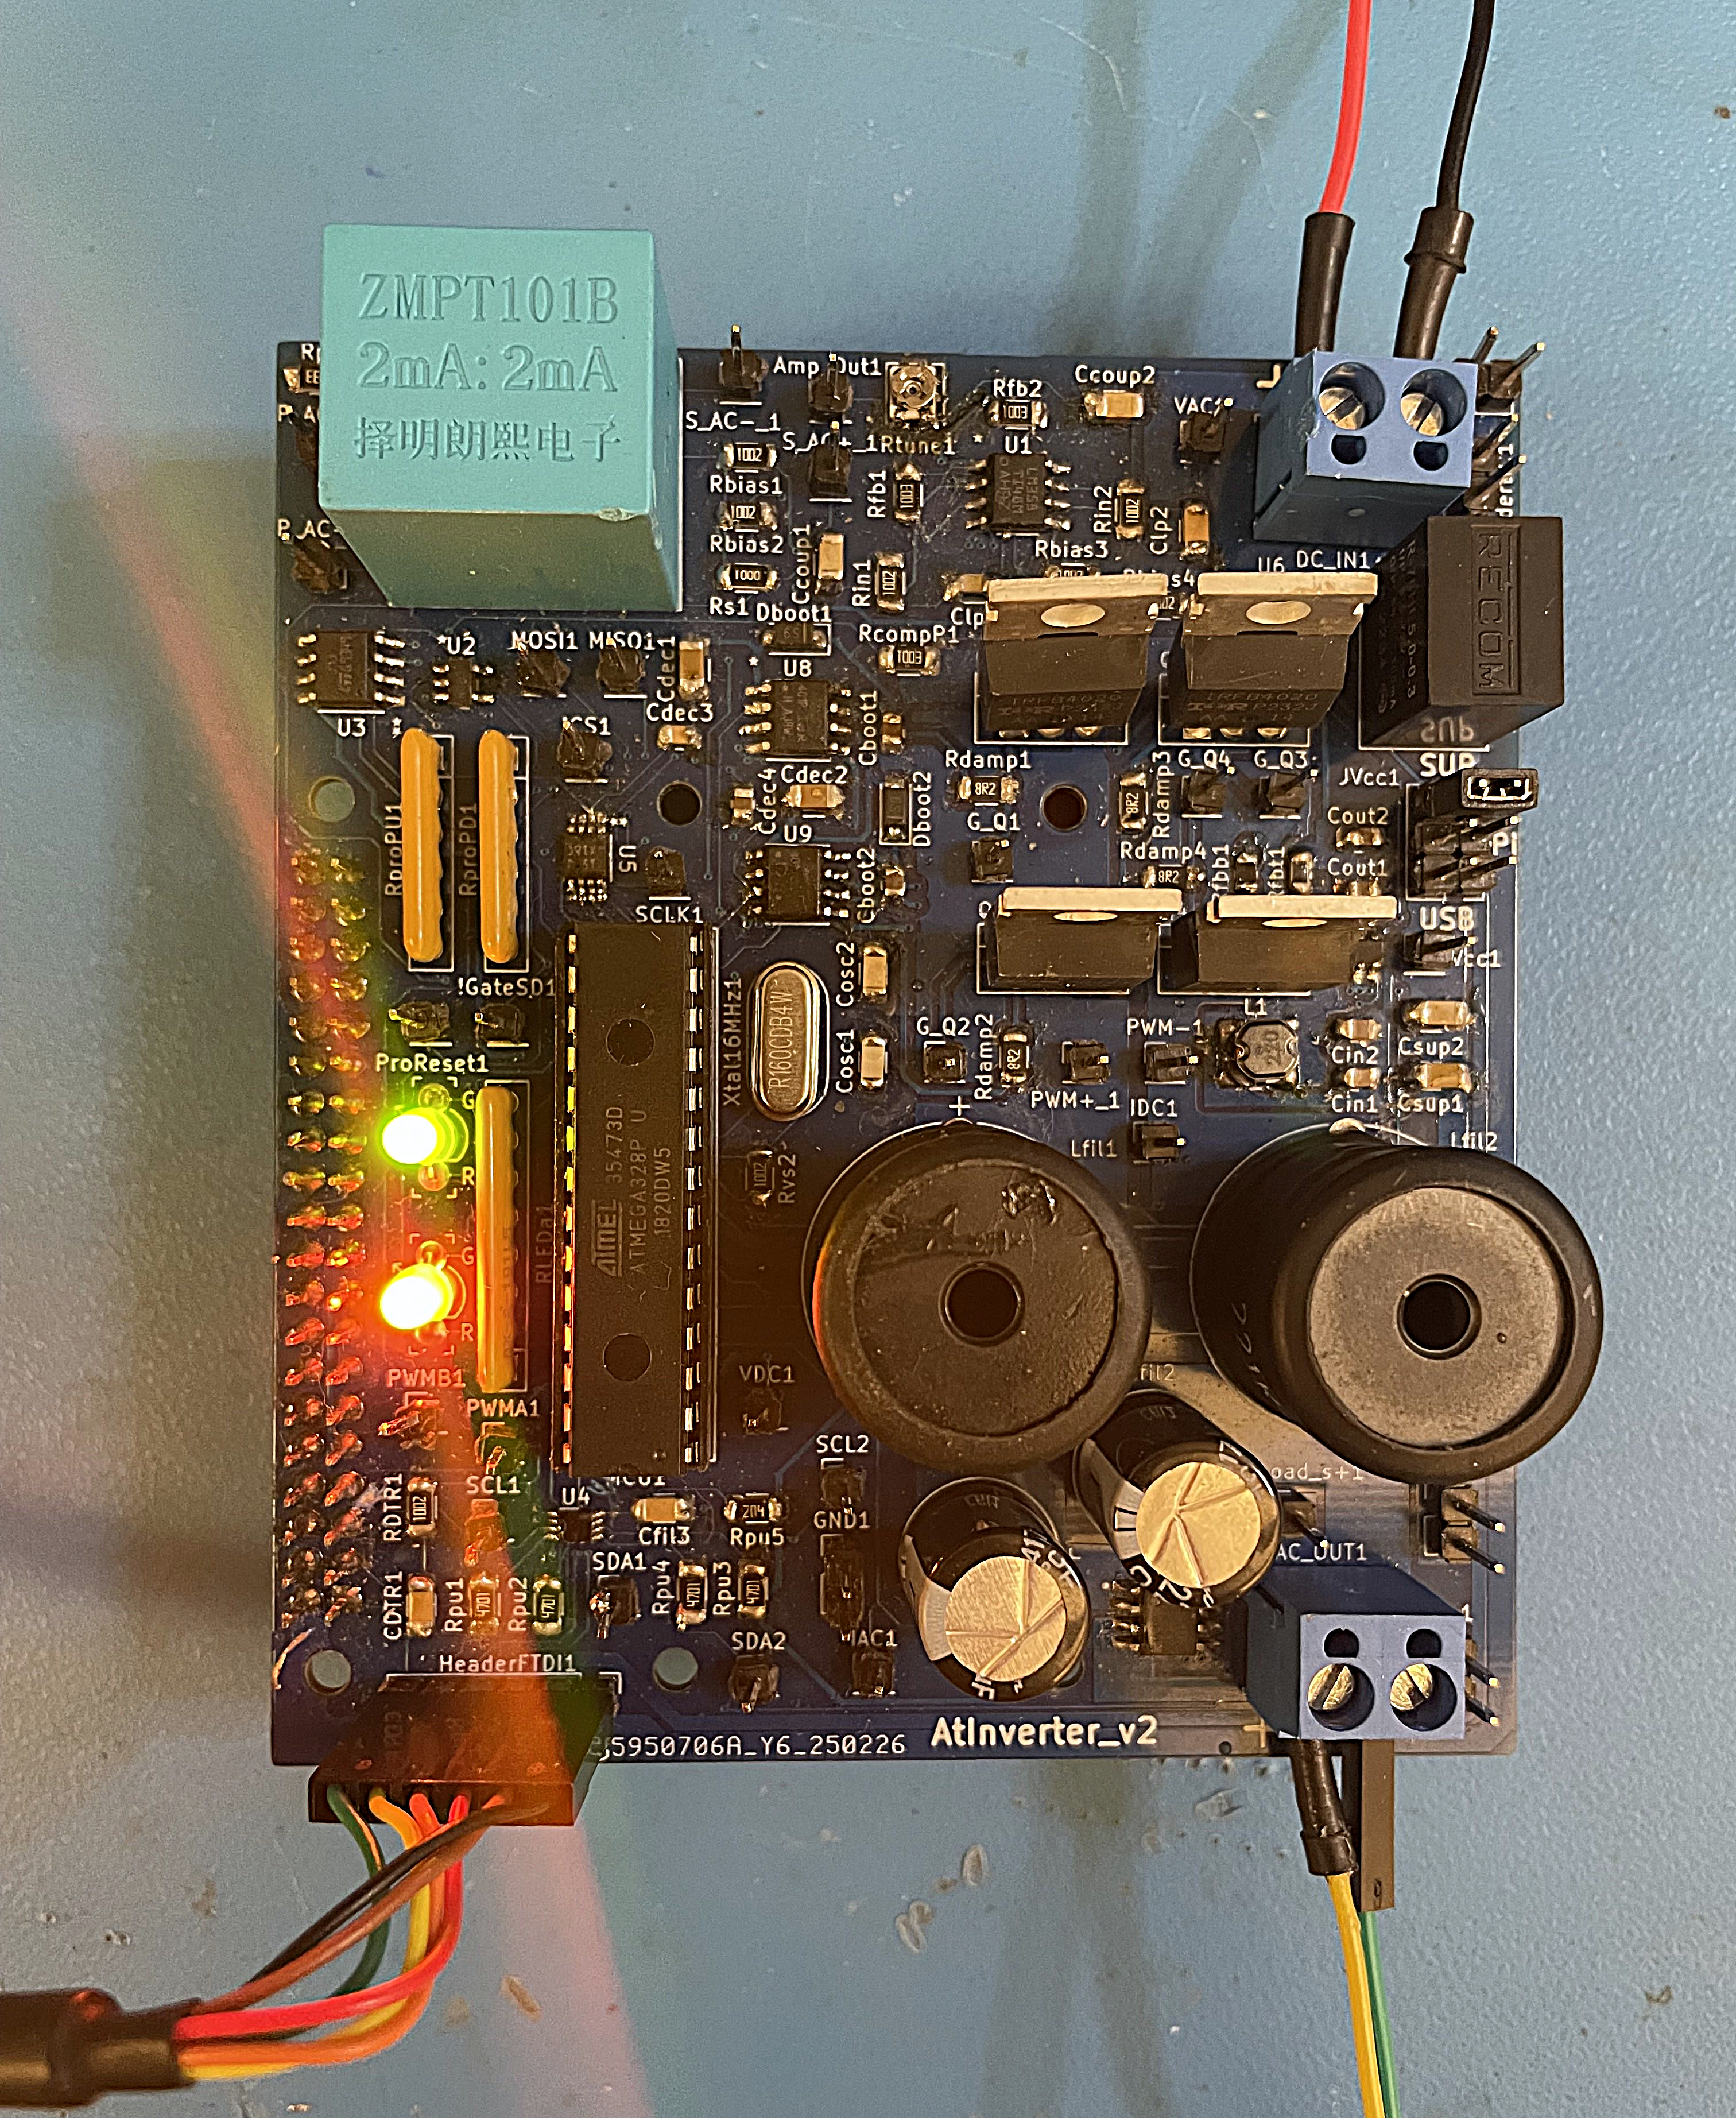
- ATMEGA328P is operational and performs LED blinking in accordance with the program routine.
PWM Inversion
This section verifies 50Hz and 60Hz PWM inversion employing the 50Hz_PWM_Inverter.ino and 60Hz_PWM_Inverter.ino software. Given the sequential waveform behavior across different stages of the power inverter, the section is organized into subsections to highlight waveforms specific to each stage.
PWM Generation
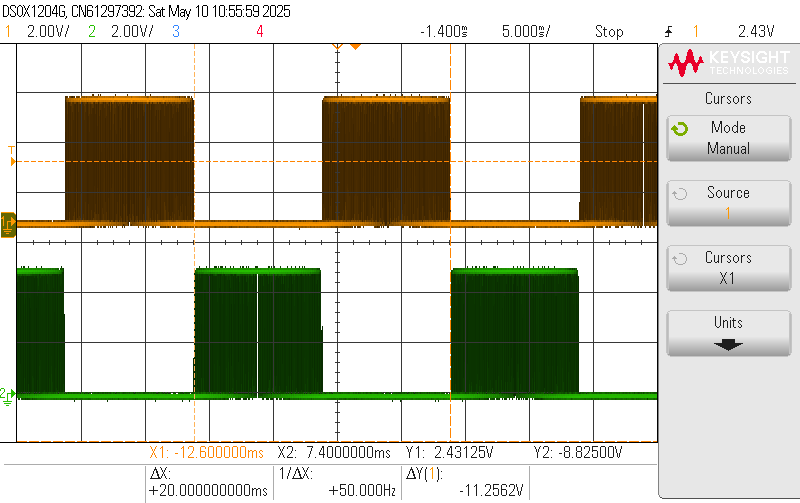
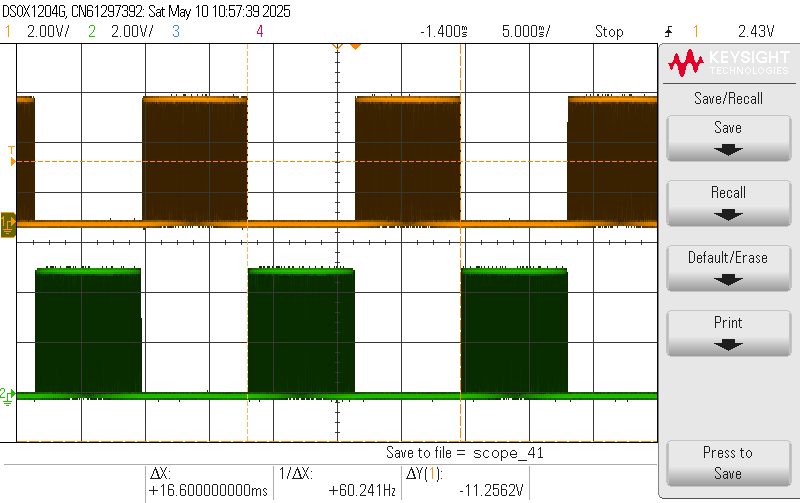
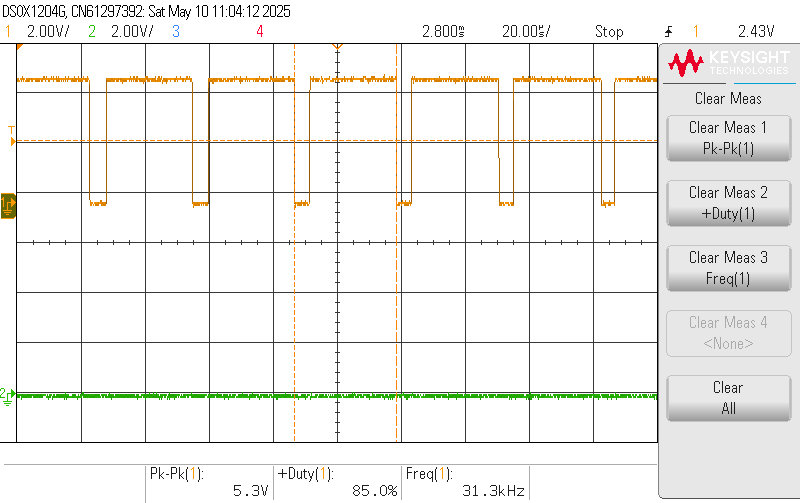
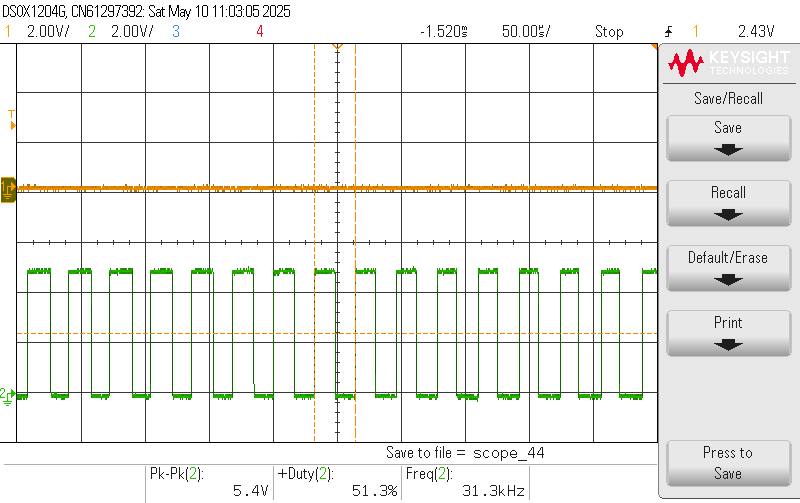
- The PWM generation by the ATMEGA328P’s digital pins is functioning as intended. The PWM outputs exhibit a 180° phase offset as they are complementary and align with the expected fundamental and switching frequencies of 50Hz or 60Hz and 31.372kHz respectively.
Gate Driver
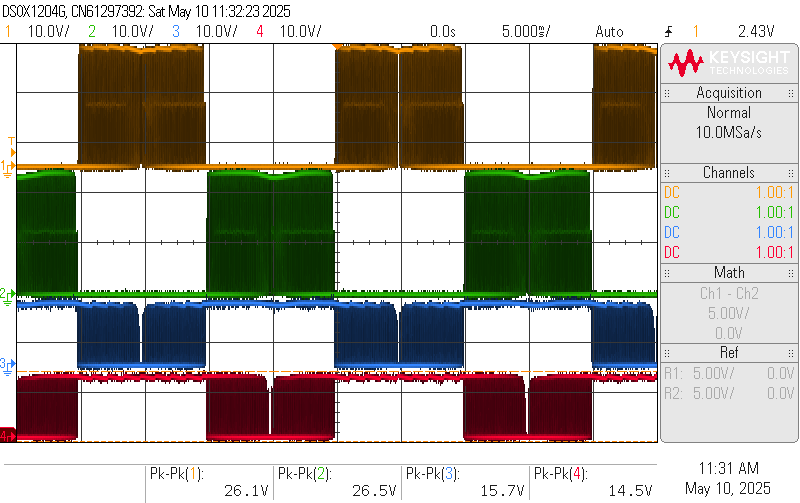
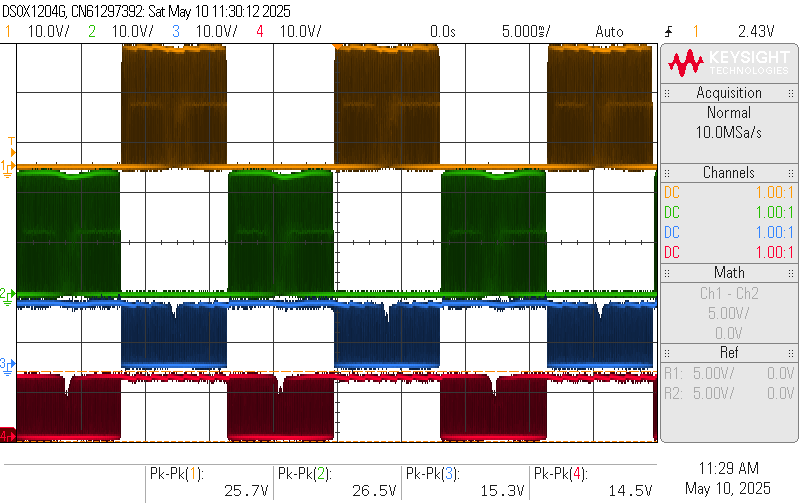
- The software generated PWM waveforms provided to the input of the gate drivers are properly level-shifted for both the high-side gate drive output (HO) and low-side gate drive output (LO). The LO output is level-shifted from the 5V logic input to 12V due to the internal CMOS structure of the IR2302, which toggles the output between ground and the 12V gate driver supply. The HO, is level-shifted from the 5V logic input to approximately 24V. This level shift is a result of the 12V gate driver supply connected to the $V_{B}$ node through a diode and the bootstrap capacitor voltage which adds another 12V when fully charged. This bootstrap capacitor is charged when the low-side switch is active while the high-side switch is on and vice versa when the high-side switch is active and the low-side switch is off, the bootstrap capacitor discharges to the HO node.
H-Bridge and LC Filter
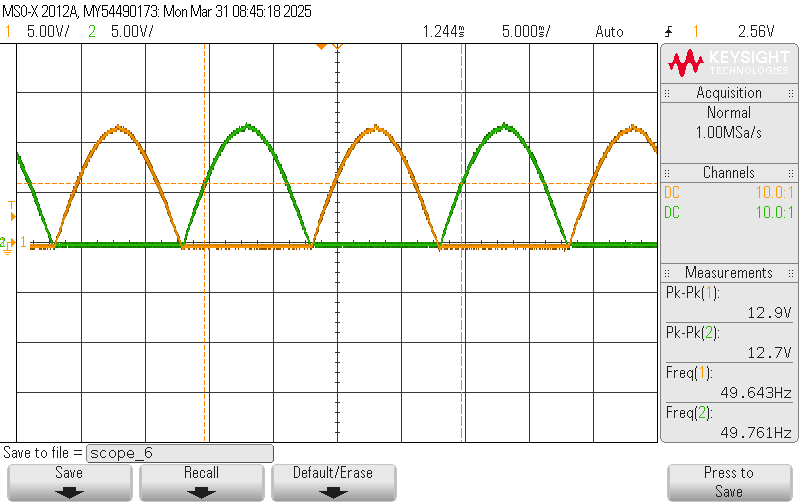
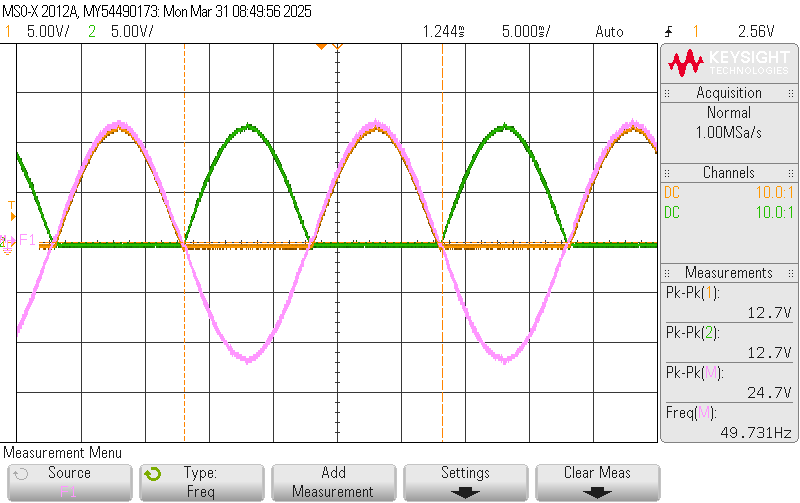
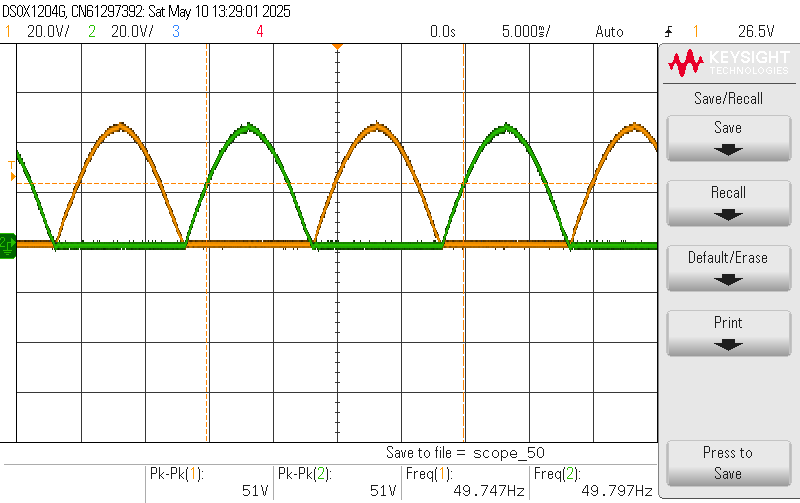
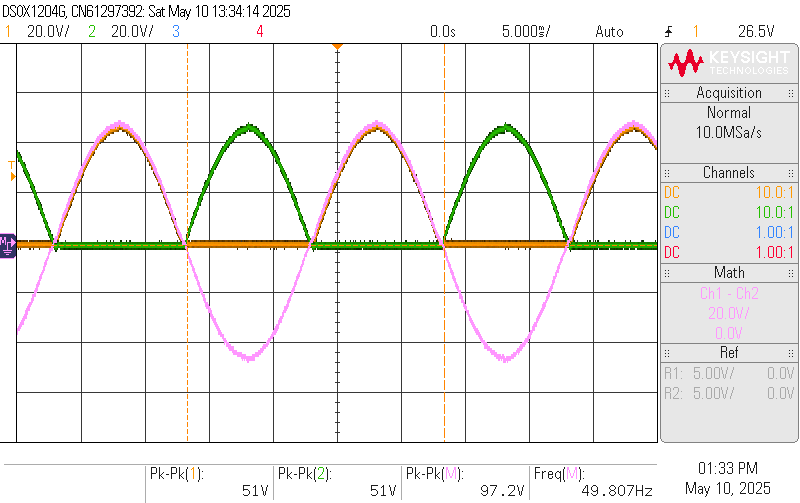
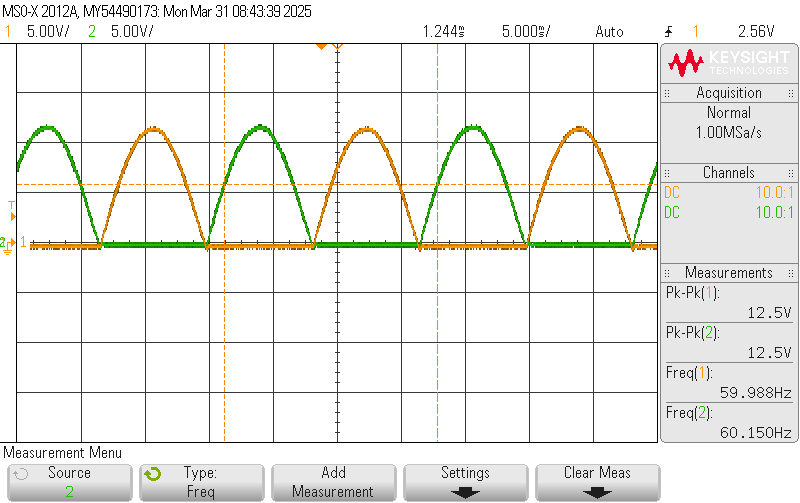
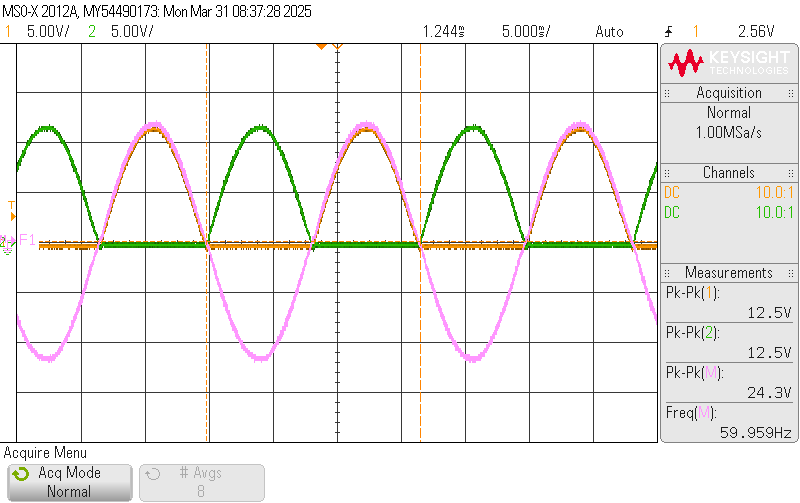
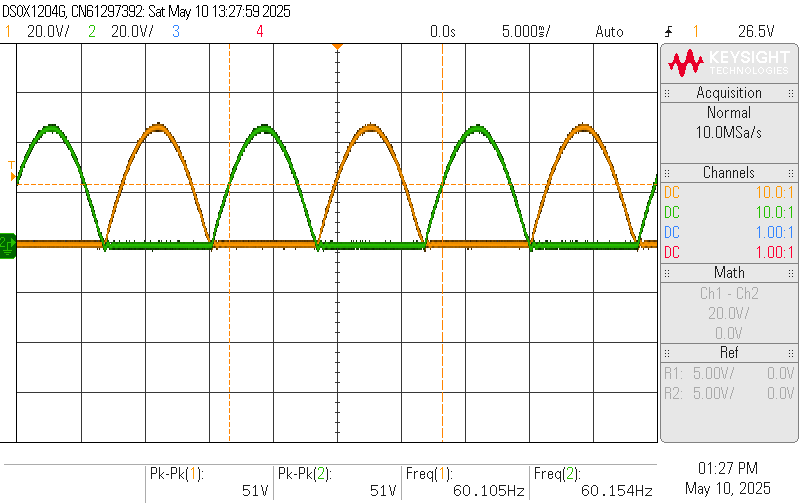
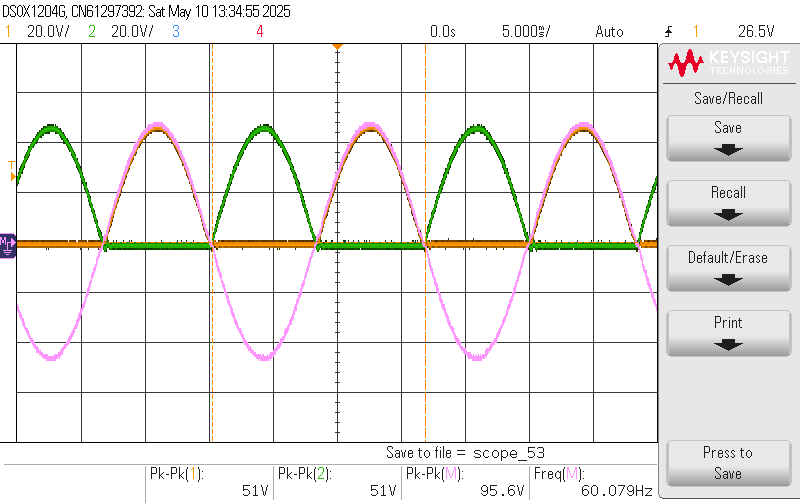
- The PWM inverter was subjected to testing between the predefined range of 24V - $96V_{pkpk}$ using a 12V - 48V DC input. Oscilloscope captures were obtained at both fundamental frequencies of 50Hz and 60Hz, measuring across the load terminals to illustrate how the differential AC waveform is synthesized from the positive and negative half-cycles. Overall, the output waveform behavior is consistent with theoretical expectations.
Sensing Networks
This portion of the report addresses and experiments with the four sensing operations for the power inverter using the software modules Vdc_Sensing.ino, Idc_Sensing.ino, Vac_Sensing.ino, and Iac_Sensing.ino. Although this section does not make the distinction between the 50Hz or 60Hz fundamental frequency testing, this is intentional as the sensed values are not expected to vary significantly with frequency. Testing was performed for the DC input voltage of 12V - 48V with representative results for both 12V and 48V documented in this section.
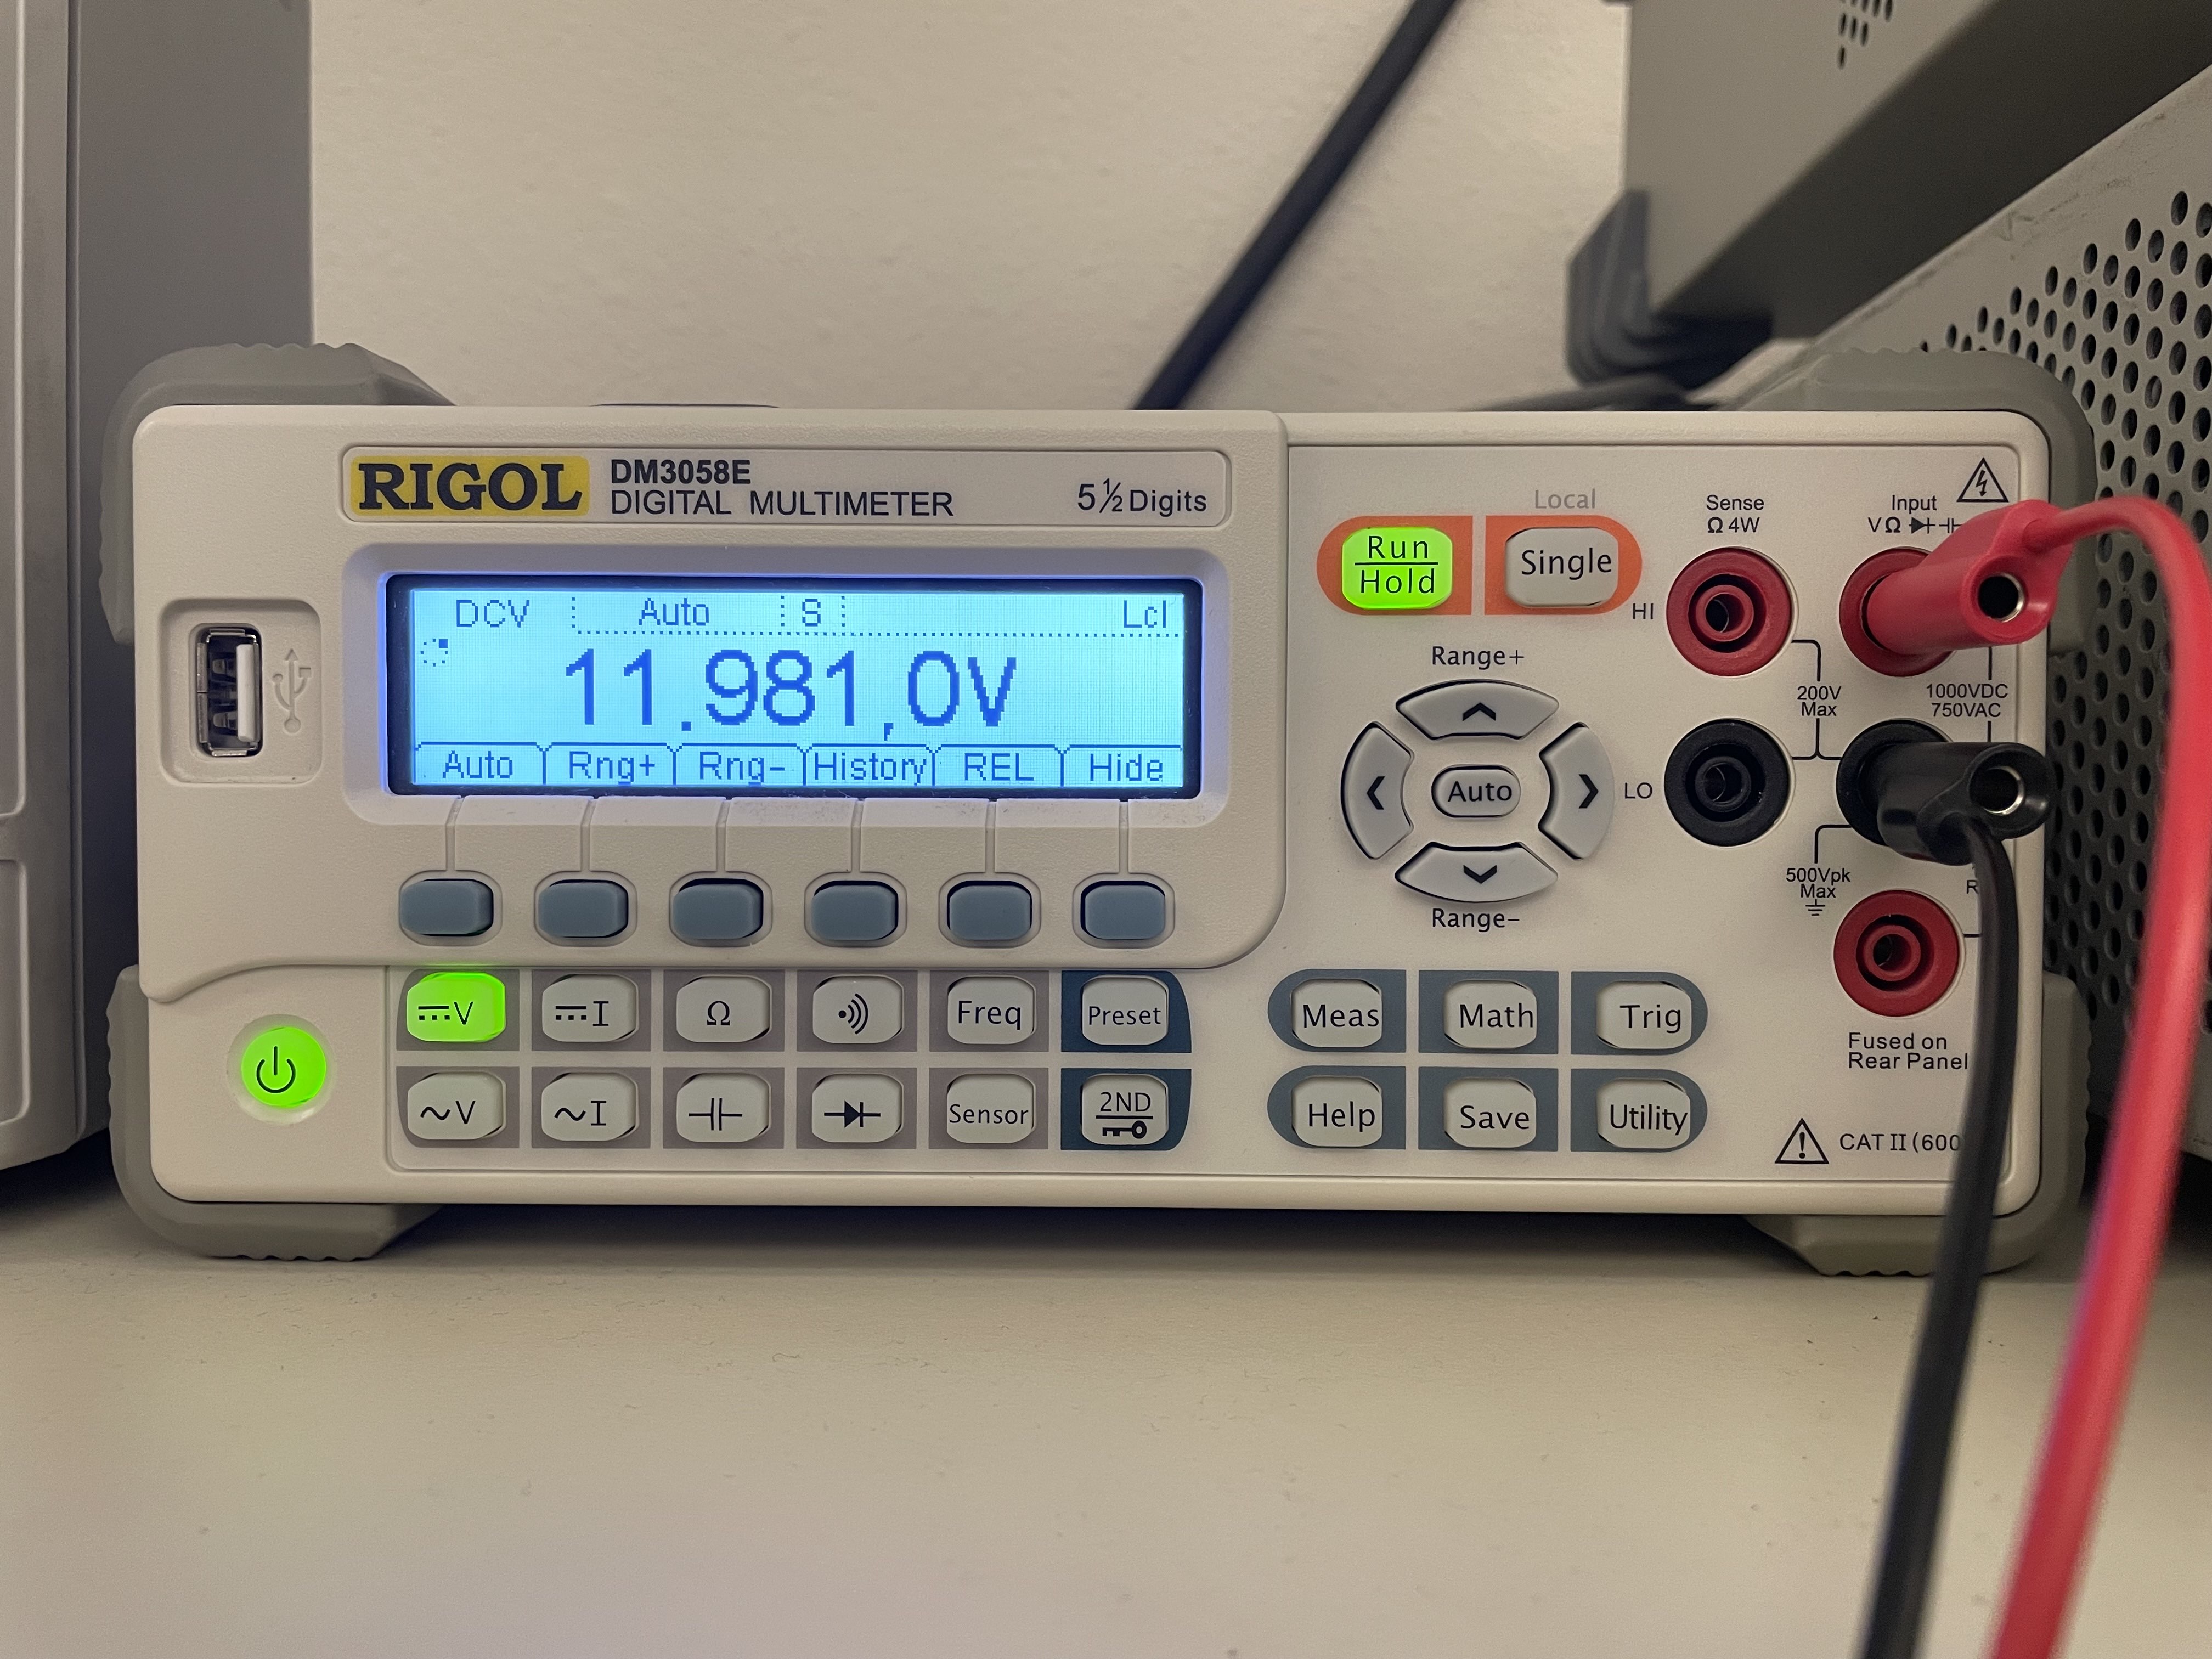
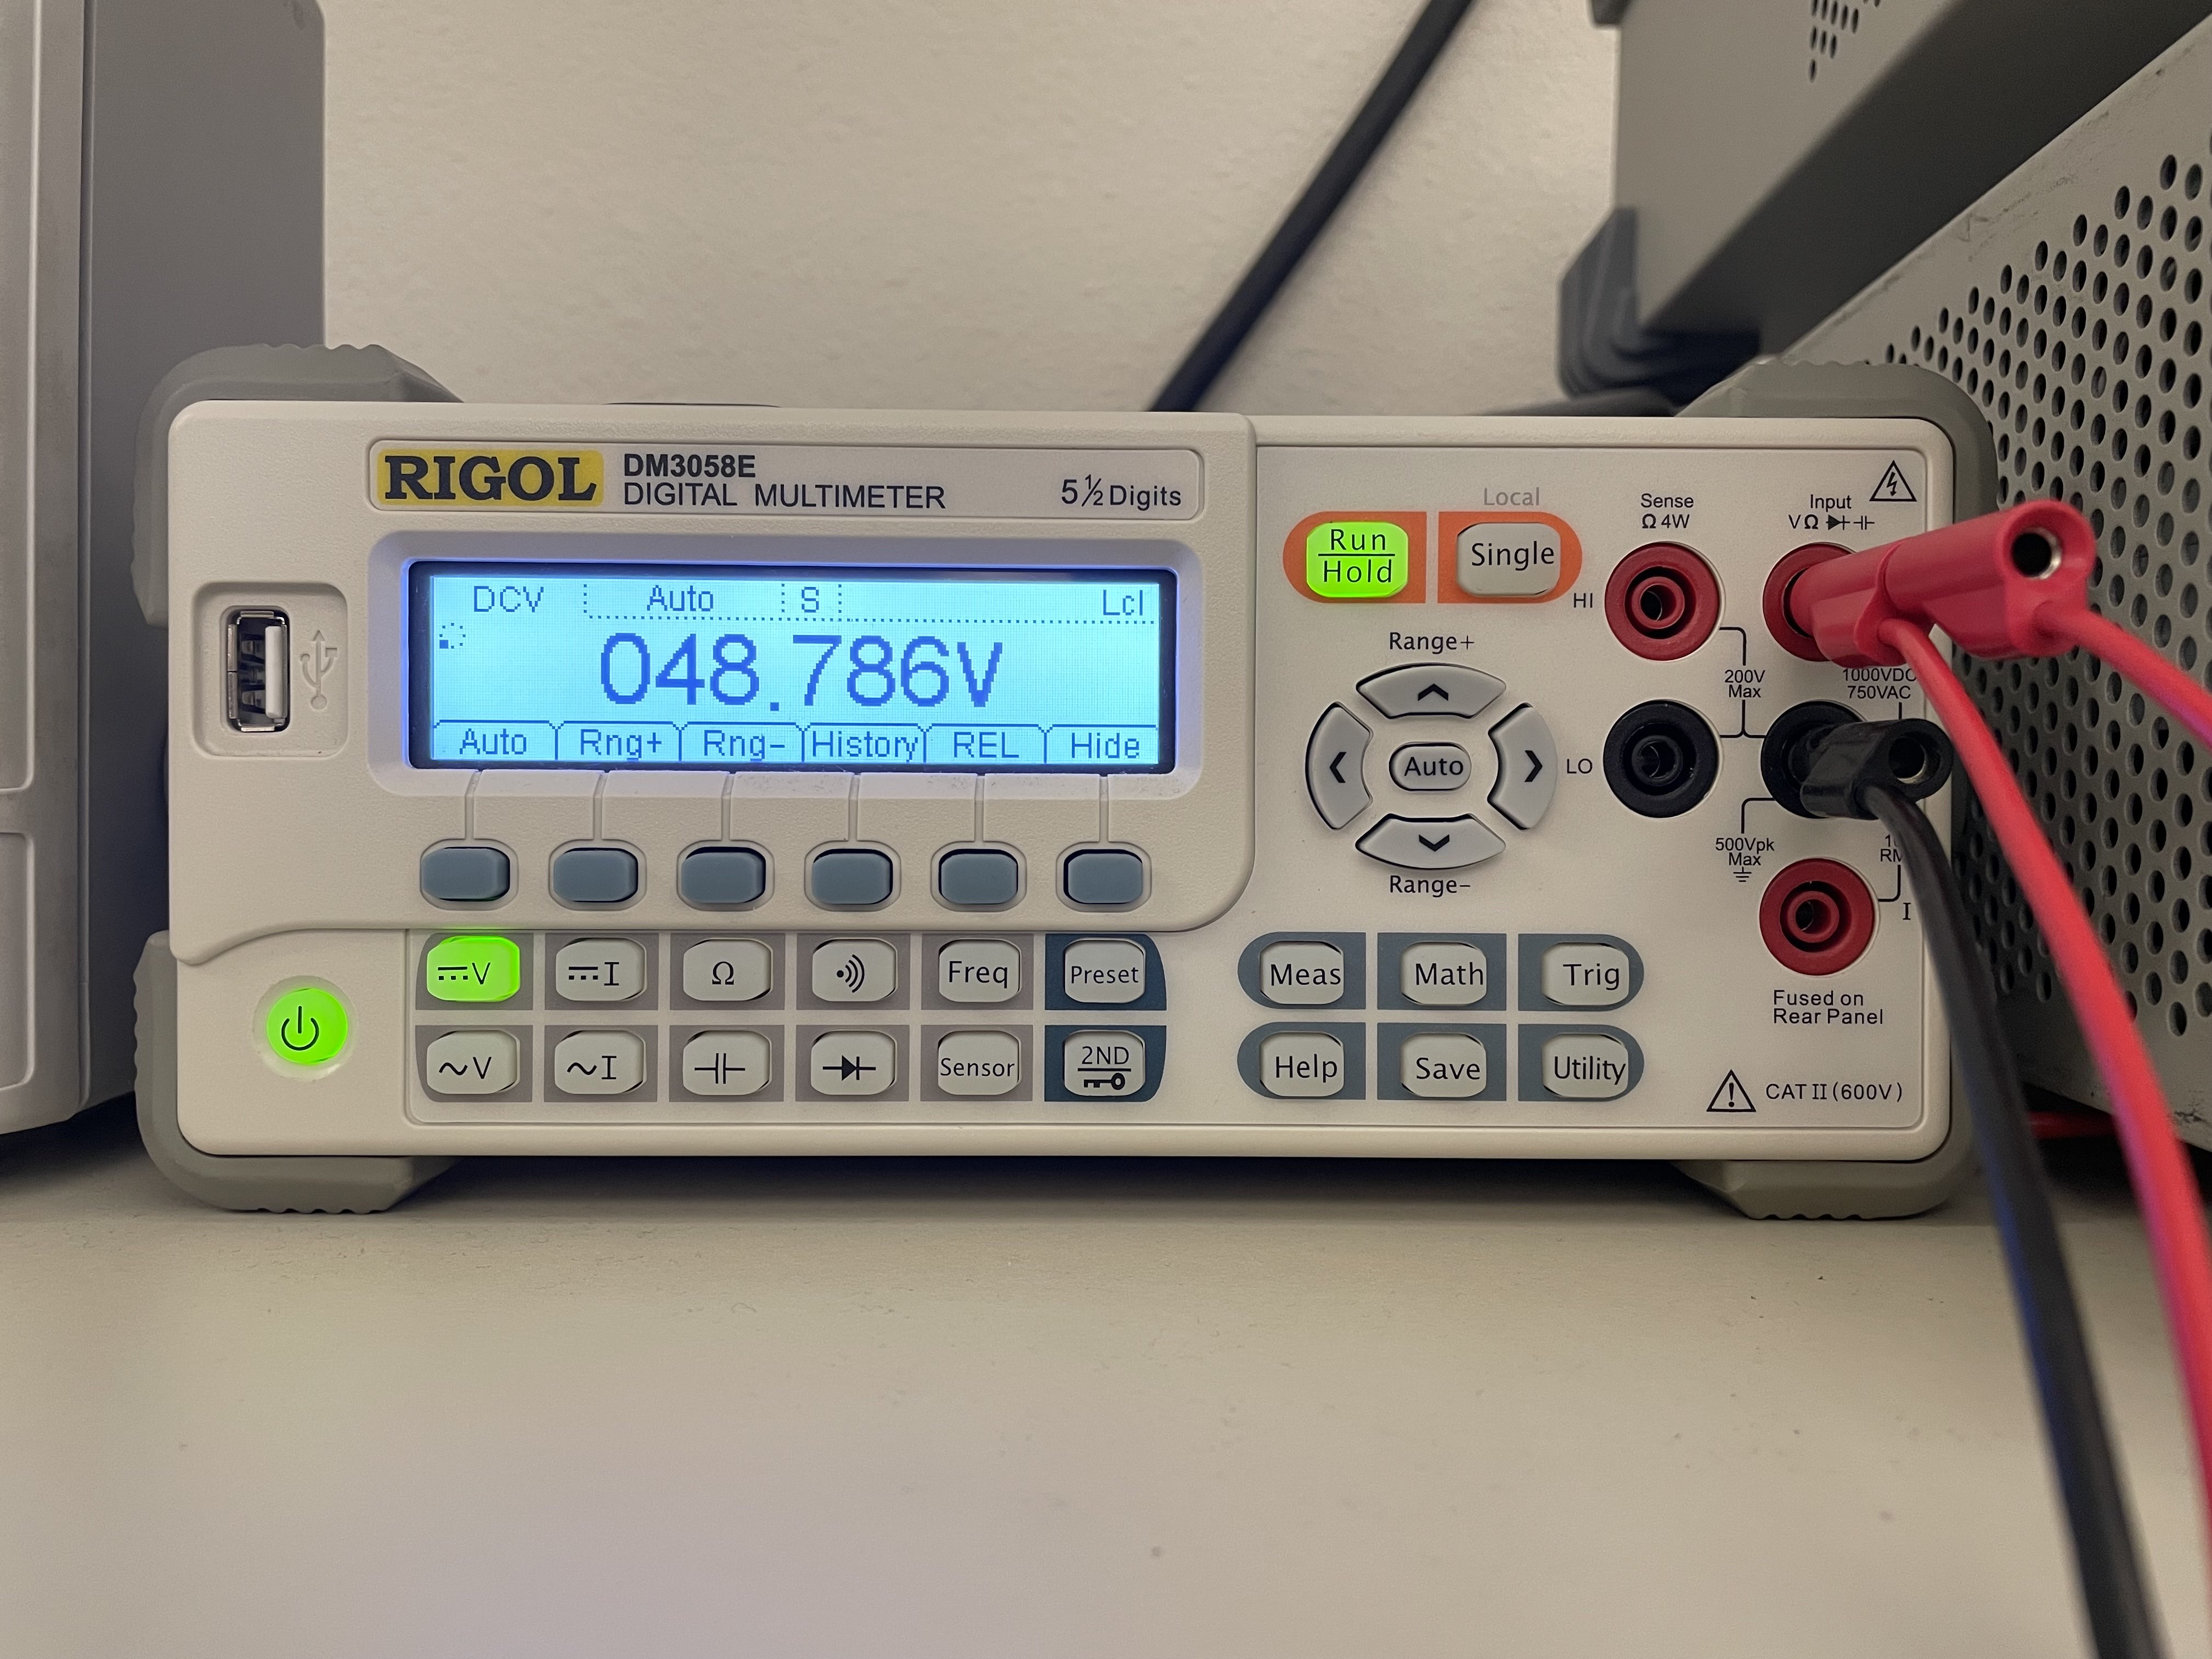
DC Voltage Sensing
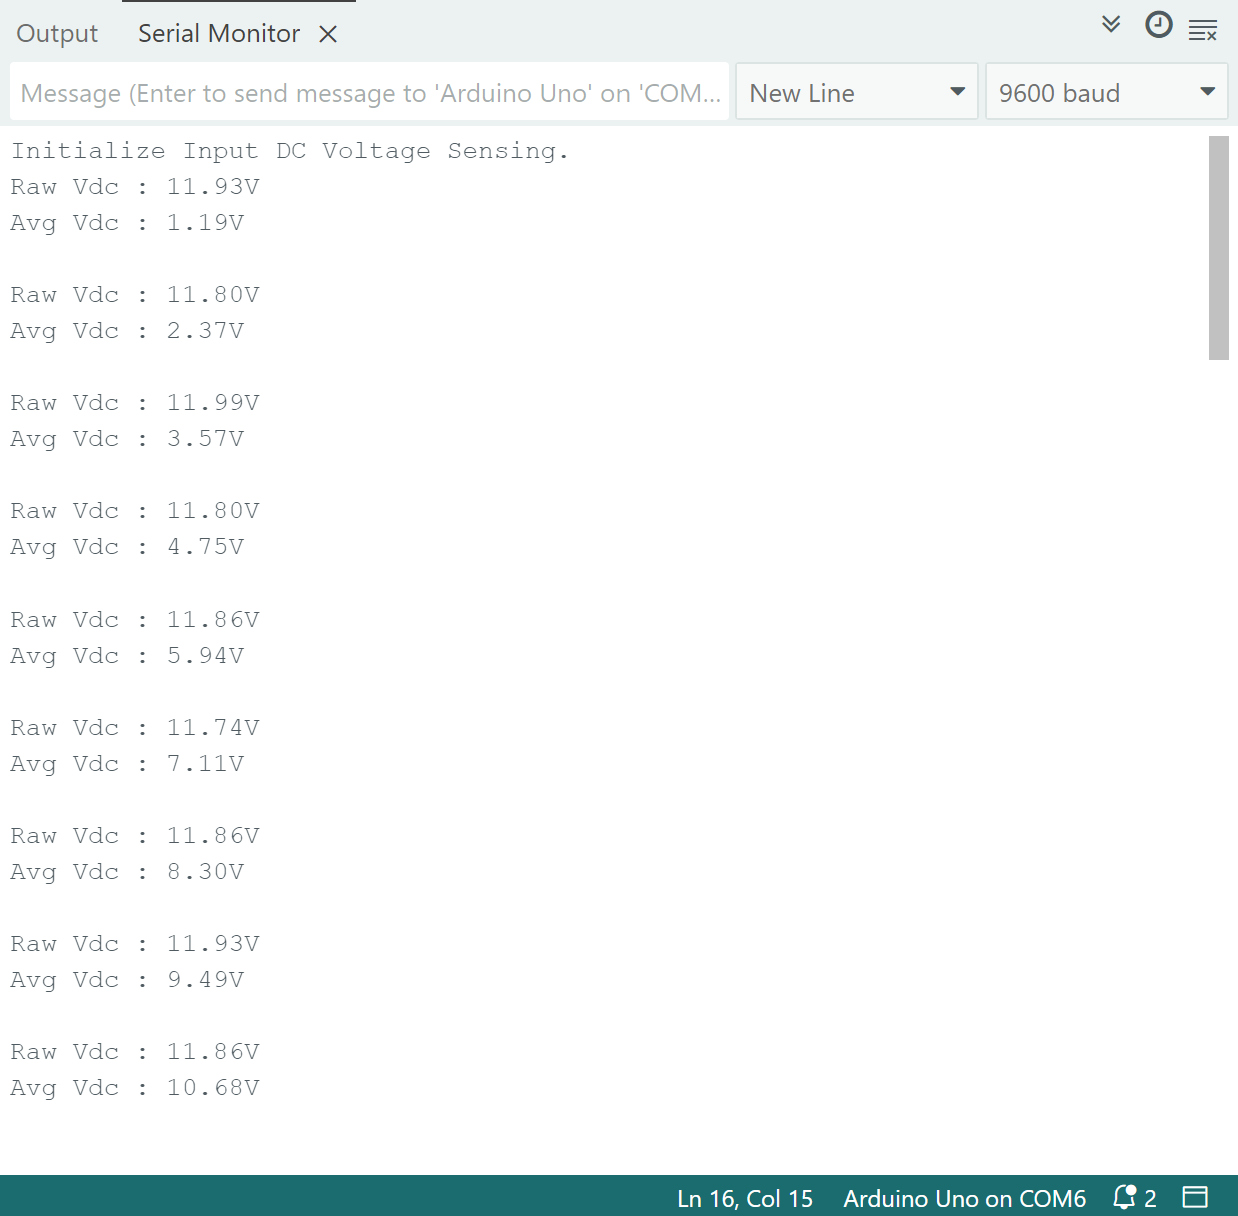
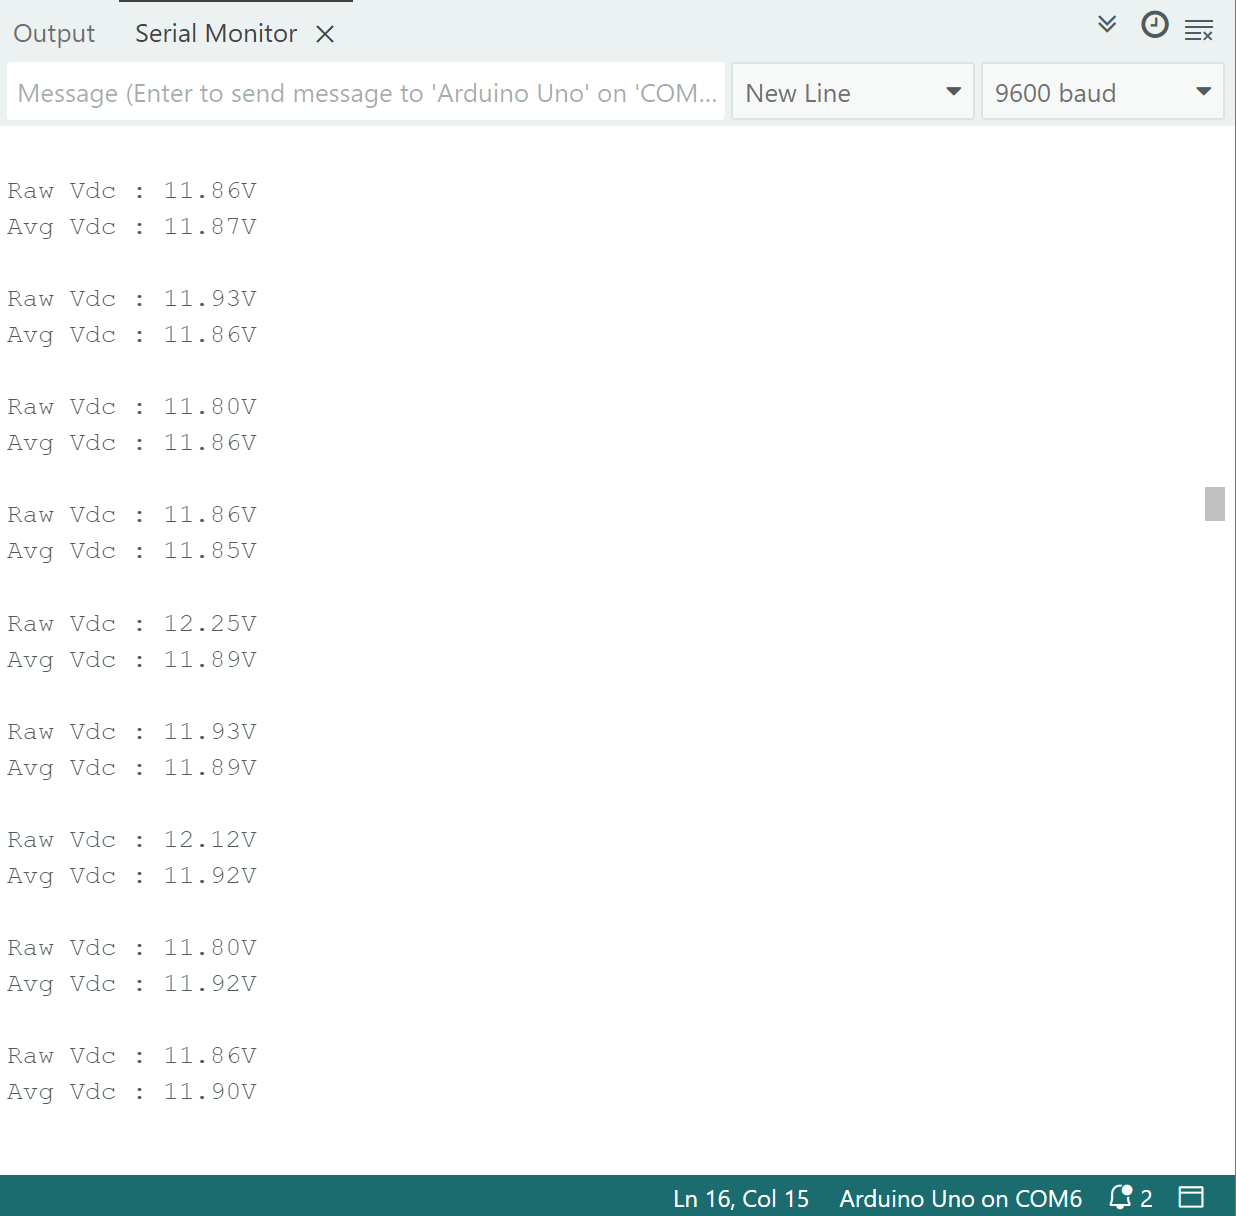
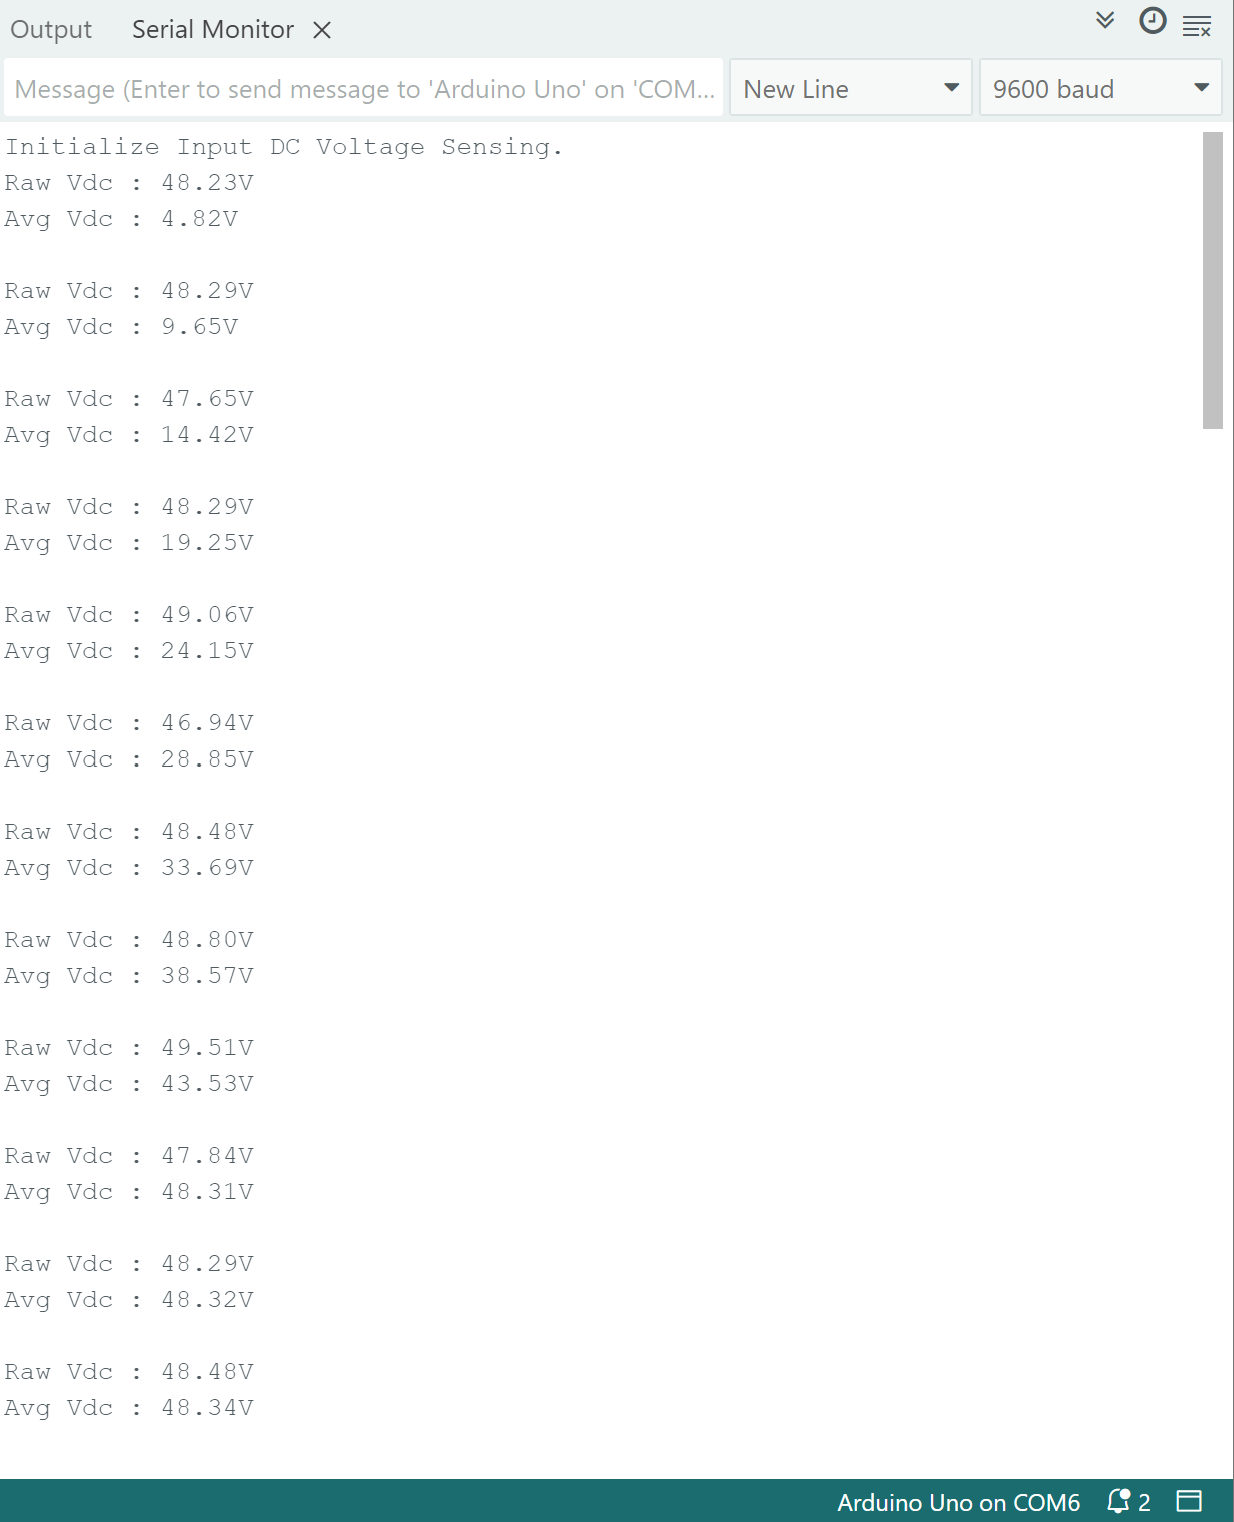
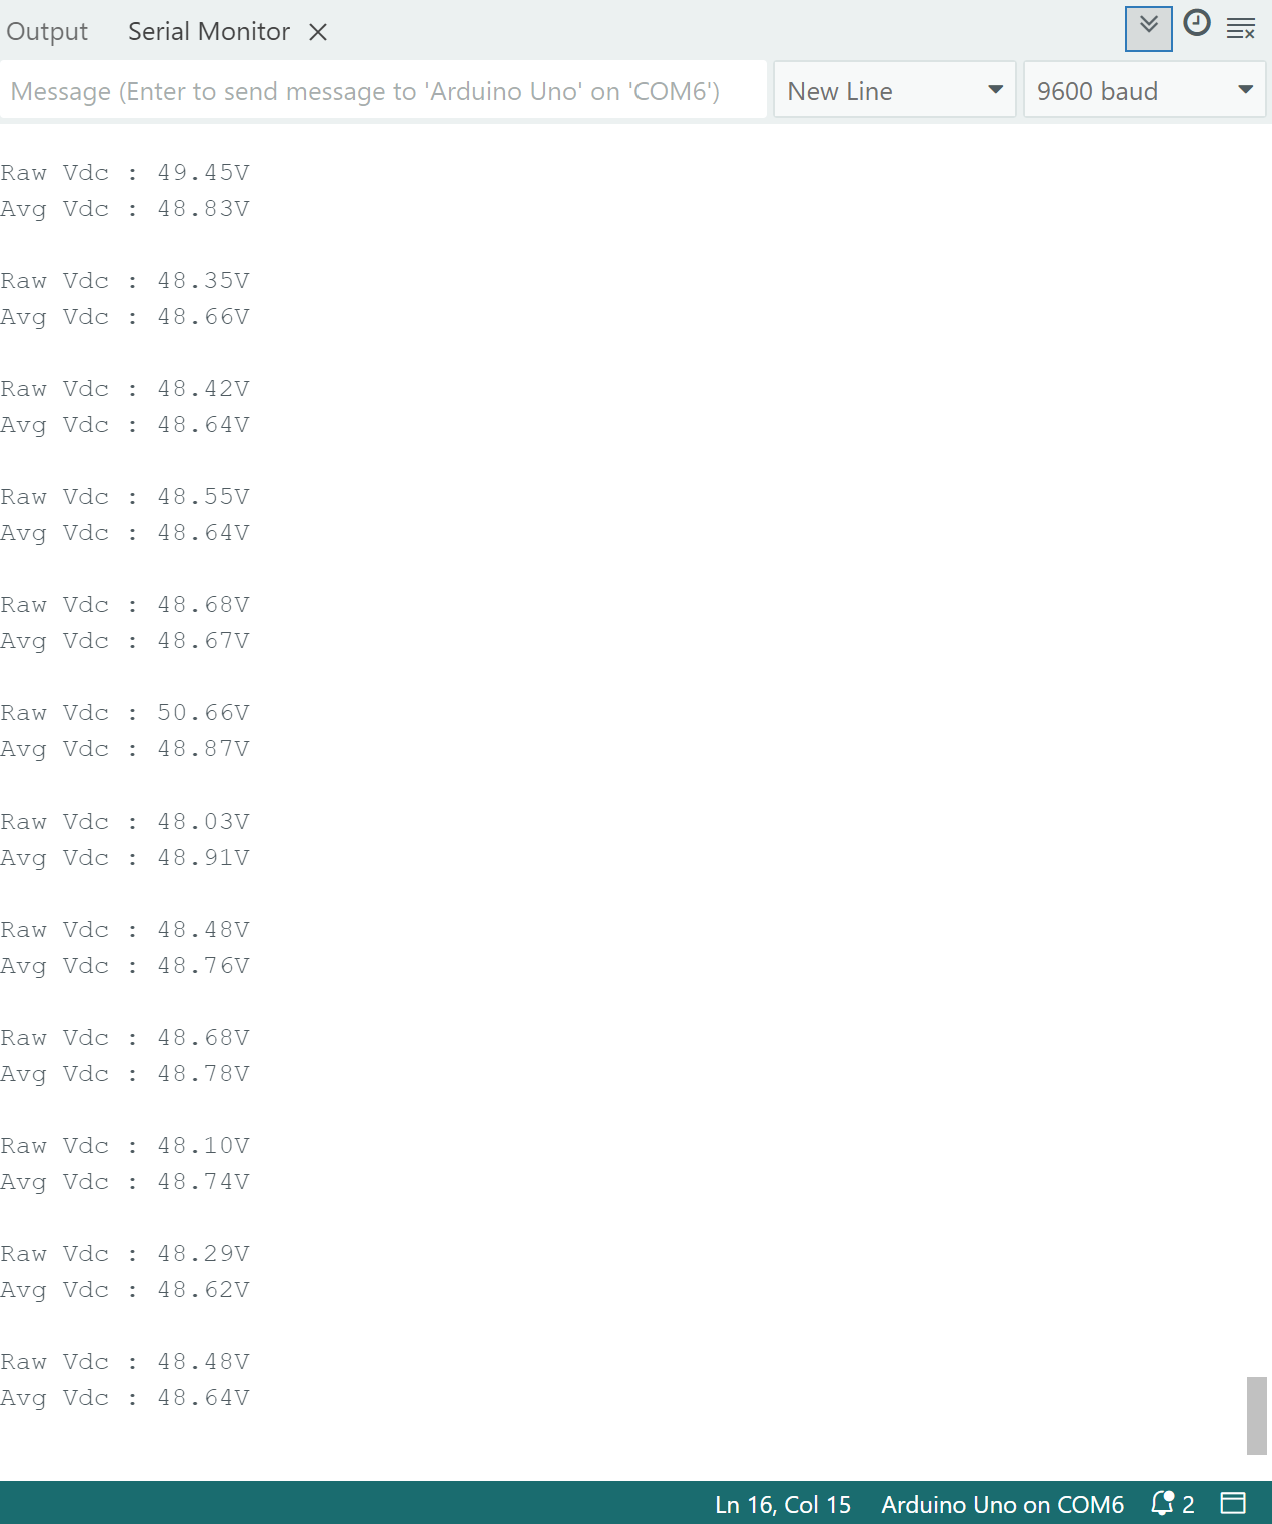
- Execution of the
Vdc_Sensing.inoprogram at both 12V and 48V DC levels produces results that are quite favorable. Start up conditions were in accordance with expected operation as the running average logic tells us that the DC voltage value improves in accuracy once it completely fills its buffer. Additionally, under steady-state conditions the sensed voltage closely matched the measured value, with deviations limited to a few tens of millivolts—well within the acceptable range for this design.
DC Current Sensing
| Nominal Load Resistance | Nominal Load Current | Measured Load Resistance | Calculated Load Current | Sensed Load Current |
|---|---|---|---|---|
| 69.6Ω | 0.172A | 71.422Ω | 0.168A | |
| 34.8Ω | 0.333A | 36.003Ω | 0.333A | |
| 23.2Ω | 0.517A | 24.278Ω | 0.494A | |
| 17.4Ω | 0.689A | 18.087Ω | 0.663A |
| Nominal Load Resistance | Nominal Load Current | Measured Load Resistance | Calculated Load Current | Sensed Load Current |
|---|---|---|---|---|
| 69.6Ω | 0.689A | 71.422Ω | 0.689A | |
| 34.8Ω | 1.378A | 36.003Ω | 1.333A | |
| 23.2Ω | 2.068A | 24.278Ω | 1.977A | |
| 17.4Ω | 2.758A | 18.087Ω | 2.653A |
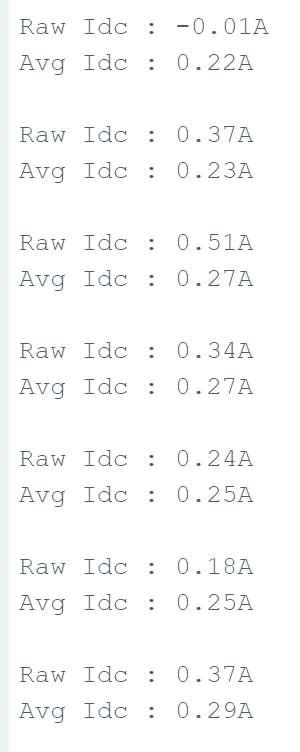
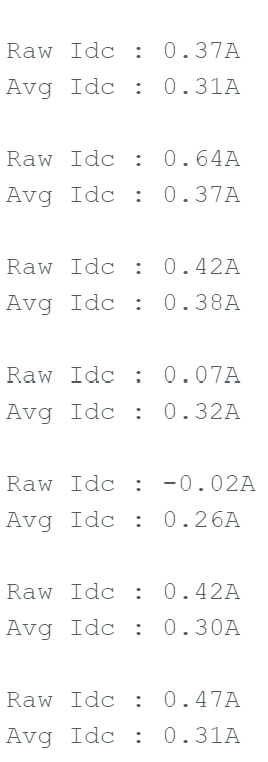
- A series of four load tests were conducted to validate the performance of the DC current sensing program. The selected load resistances span a range that covers the full output current capability of the Atinverter V2 (rated up to 2.8A), including operation at the highest DC input level of 48V.
AC Voltage Sensing
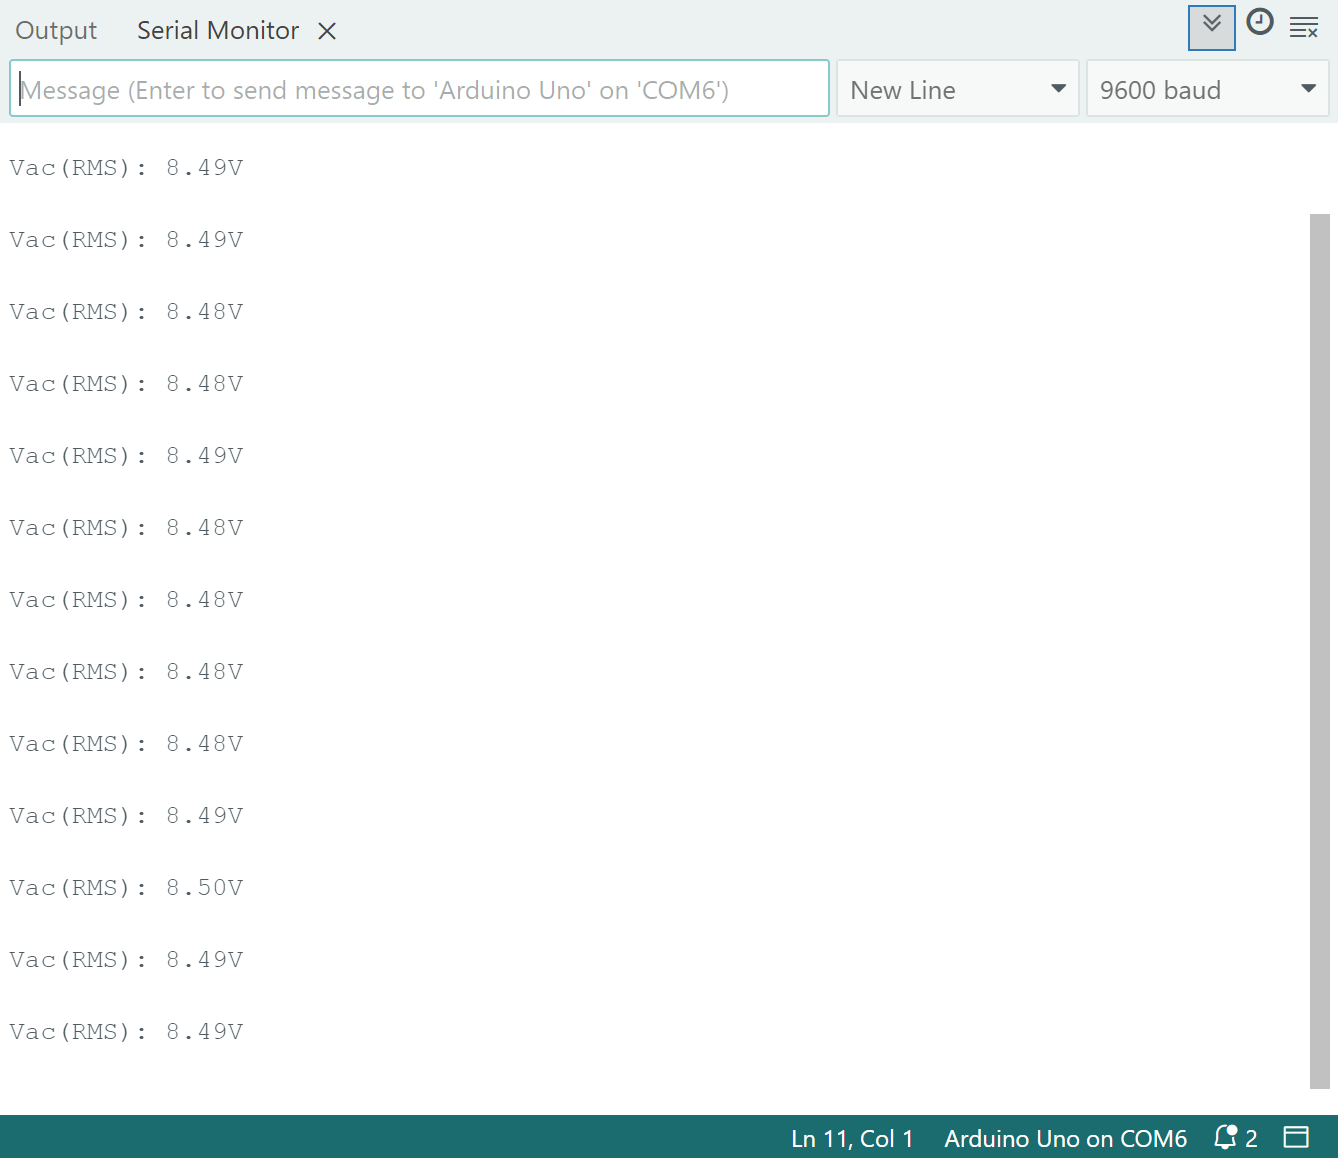
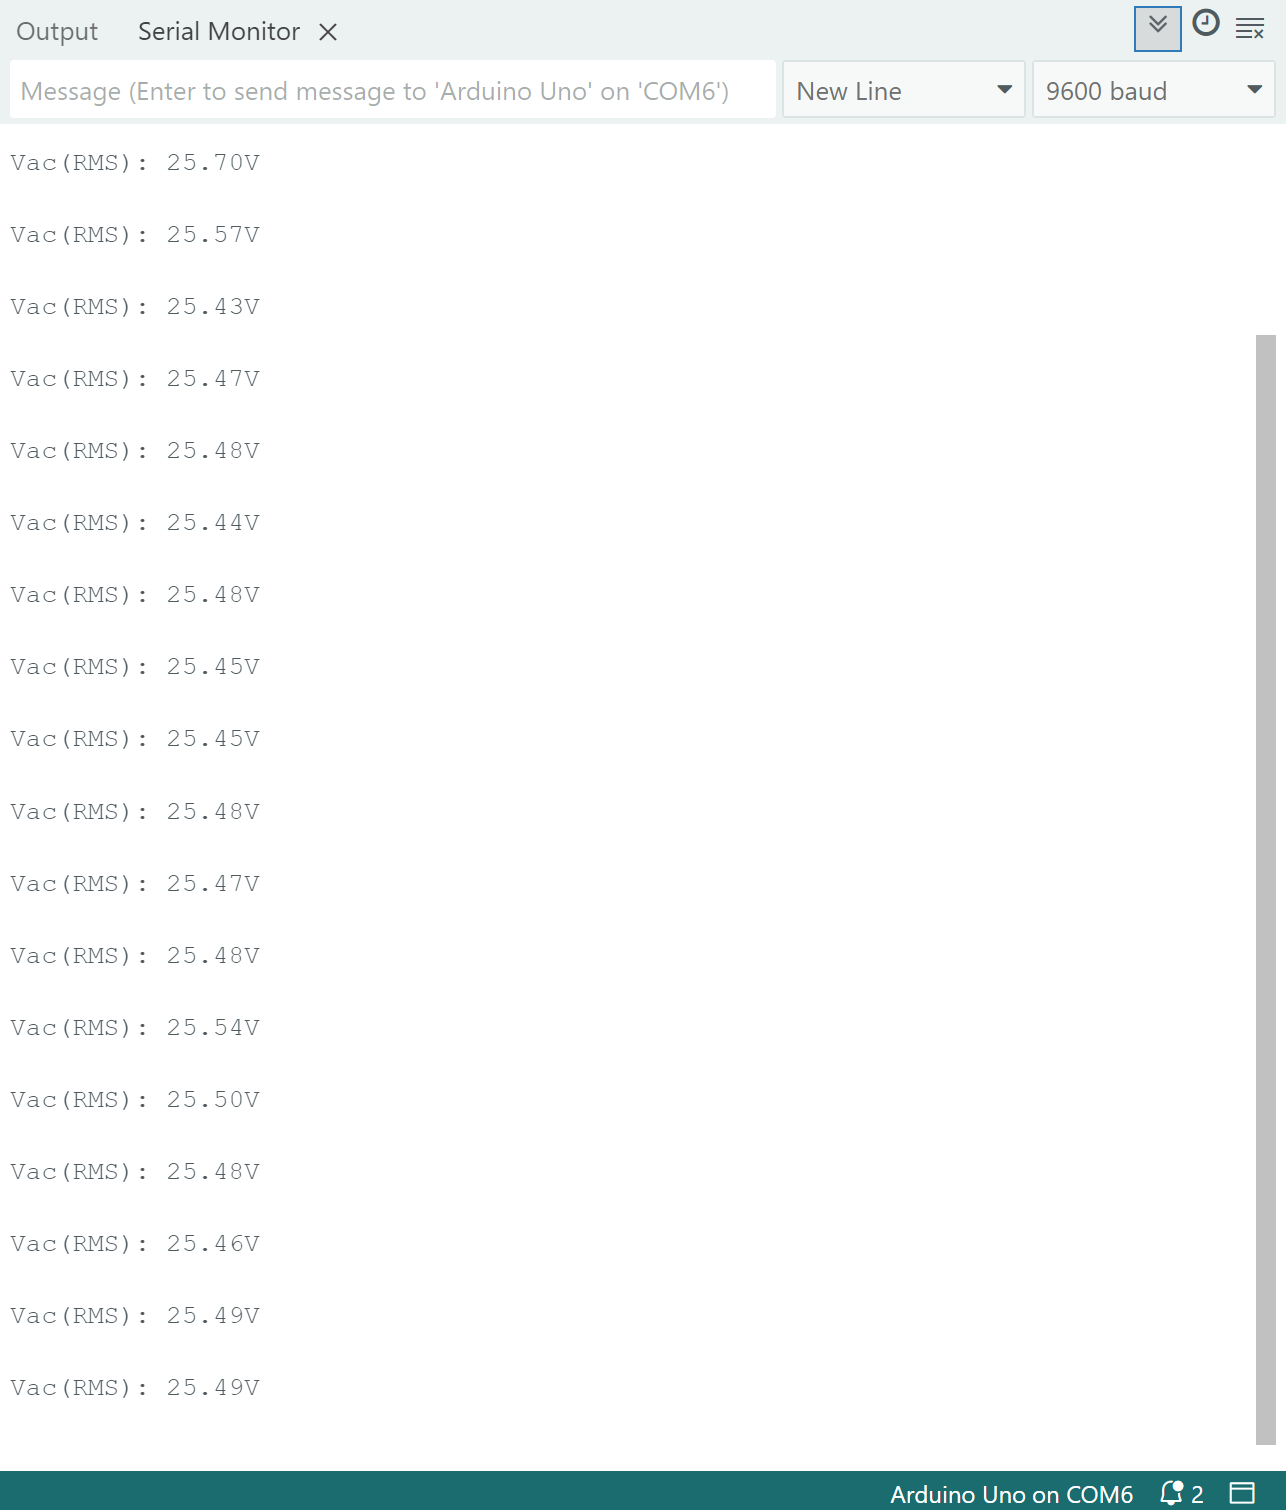
-
The
Vac_Sensing.inoprogram was evaluated at both 12V and 48V DC input levels which correspond to expected RMS output voltages of $\frac{12V}{\sqrt{2}} \approx 8.49V$ and $\frac{48V}{\sqrt{2}} \approx 33.94V$. Unlike the DC sensing routine, the AC voltage sensing program does not differentiate between startup and steady-state conditions, as it employs a fixed time-based sampling window instead of a running average. -
The AC voltage RMS sensing was found to be fairly accurate for 12V DC input level, with only millivolt deviations. However, for 48V DC input, data readouts were quite erroneous, with a discrepancy of about 8V. It turns out that the sampling resistor, $R_{samp}$, was selected at a value of $100\Omega$ prior to the simulated value of $6.8\Omega$, which produces a larger sampling voltage. Due to the excessive initial magnitude, the op-amp output saturated, leading to inaccurate RMS measurements.
AC Current Sensing
| Nominal Load Resistance | Nominal Load Current | Measured Load Resistance | Calculated Load Current | Sensed Load Current |
|---|---|---|---|---|
| 69.6Ω | 0.172A | 71.422Ω | 0.168A | |
| 34.8Ω | 0.333A | 36.003Ω | 0.333A | |
| 23.2Ω | 0.517A | 24.278Ω | 0.494A | |
| 17.4Ω | 0.689A | 18.087Ω | 0.663A |
| Nominal Load Resistance | Nominal Load Current | Measured Load Resistance | Calculated Load Current | Sensed Load Current |
|---|---|---|---|---|
| 69.6Ω | 0.689A | 71.422Ω | 0.689A | |
| 34.8Ω | 1.378A | 36.003Ω | 1.333A | |
| 23.2Ω | 2.068A | 24.278Ω | 1.977A | |
| 17.4Ω | 2.758A | 18.087Ω | 2.653A |
The AC load current sensing ca